
 Click main image to view in full screen.
Business Valuation Model: DCF, Comps & Football Field – Excel XLSX
Excel (XLSX) + supplemental PDF


BENEFITS OF THIS DOWNLOADABLE EXCEL DOCUMENT
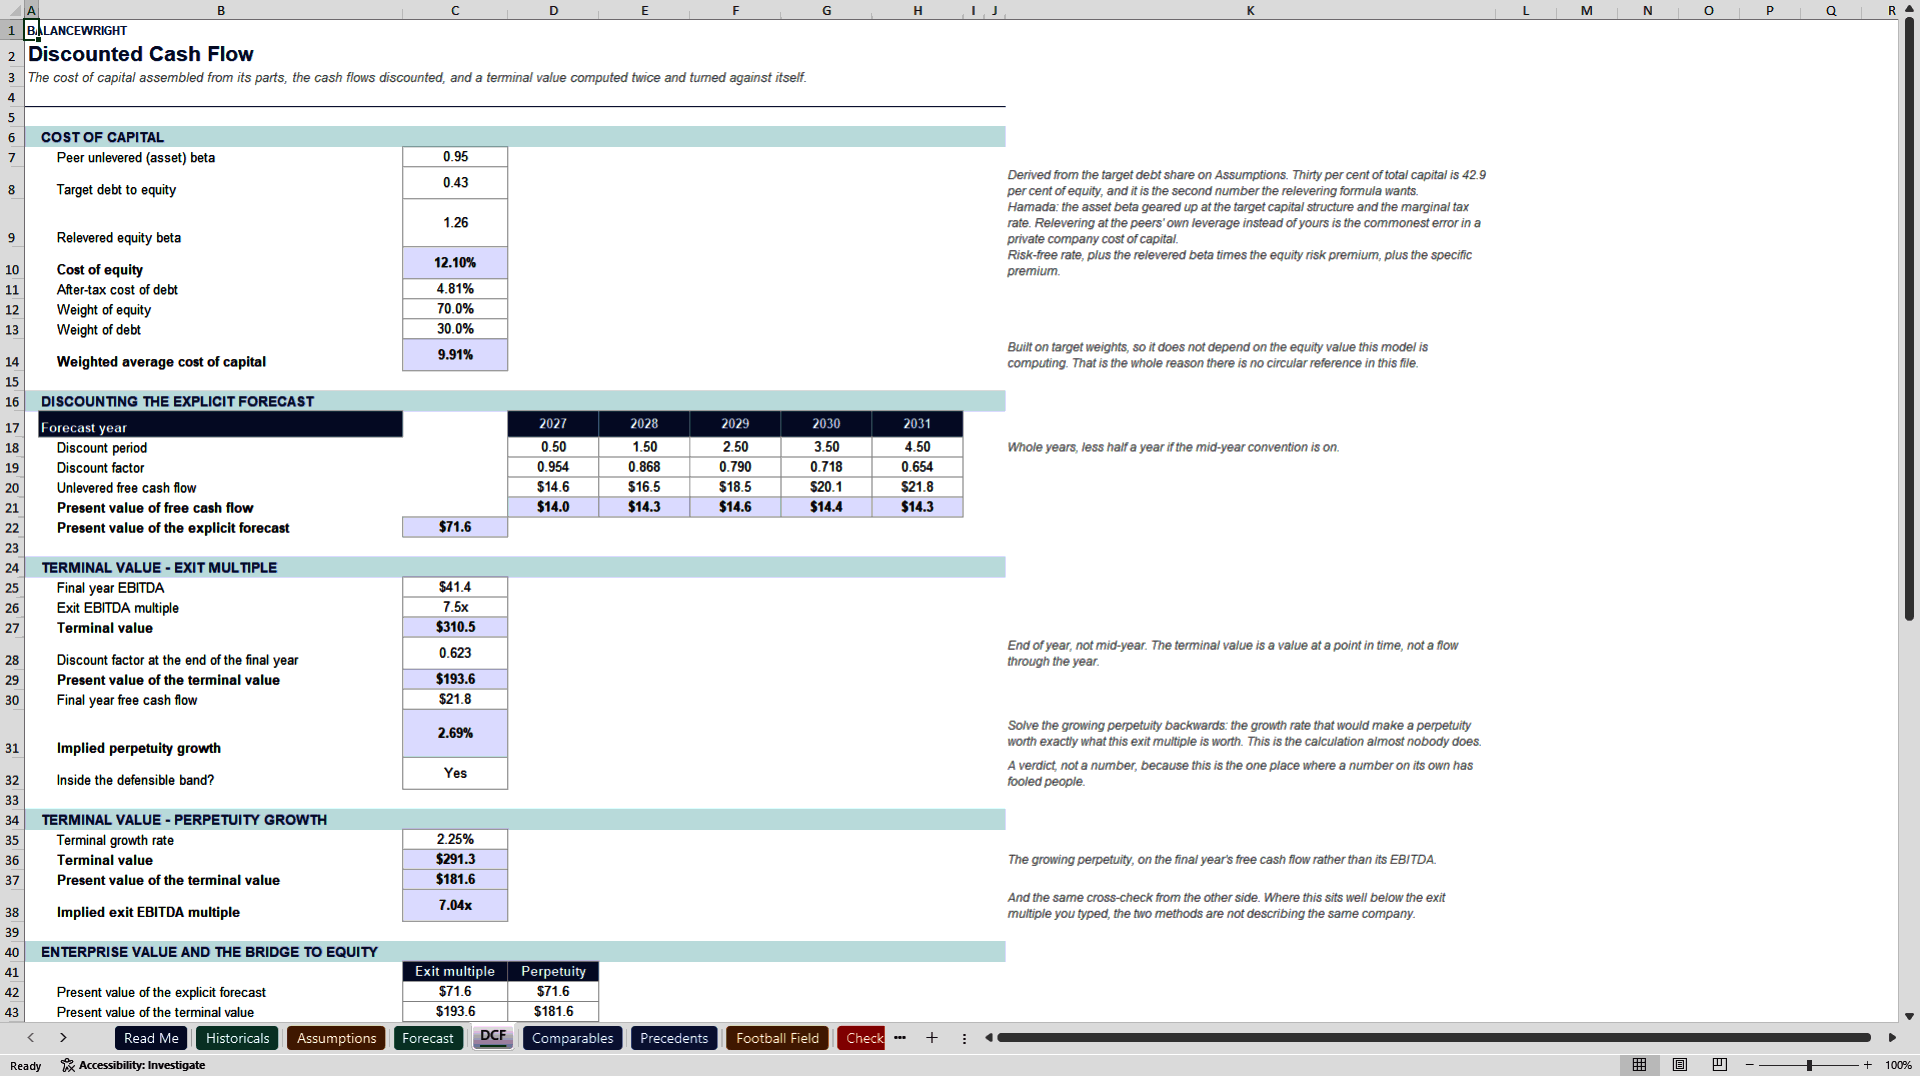
- The exit multiple is solved backwards into the perpetuity growth it implies, and the perpetuity growth forwards into the multiple it implies. The calculation almost nobody does, on the 73% of value nobody checks.
- The cost of capital is assembled: a peer asset beta relevered at your target capital structure, an explicit specific premium, a taxed cost of debt. Seven visible steps, and no circular reference in the file.
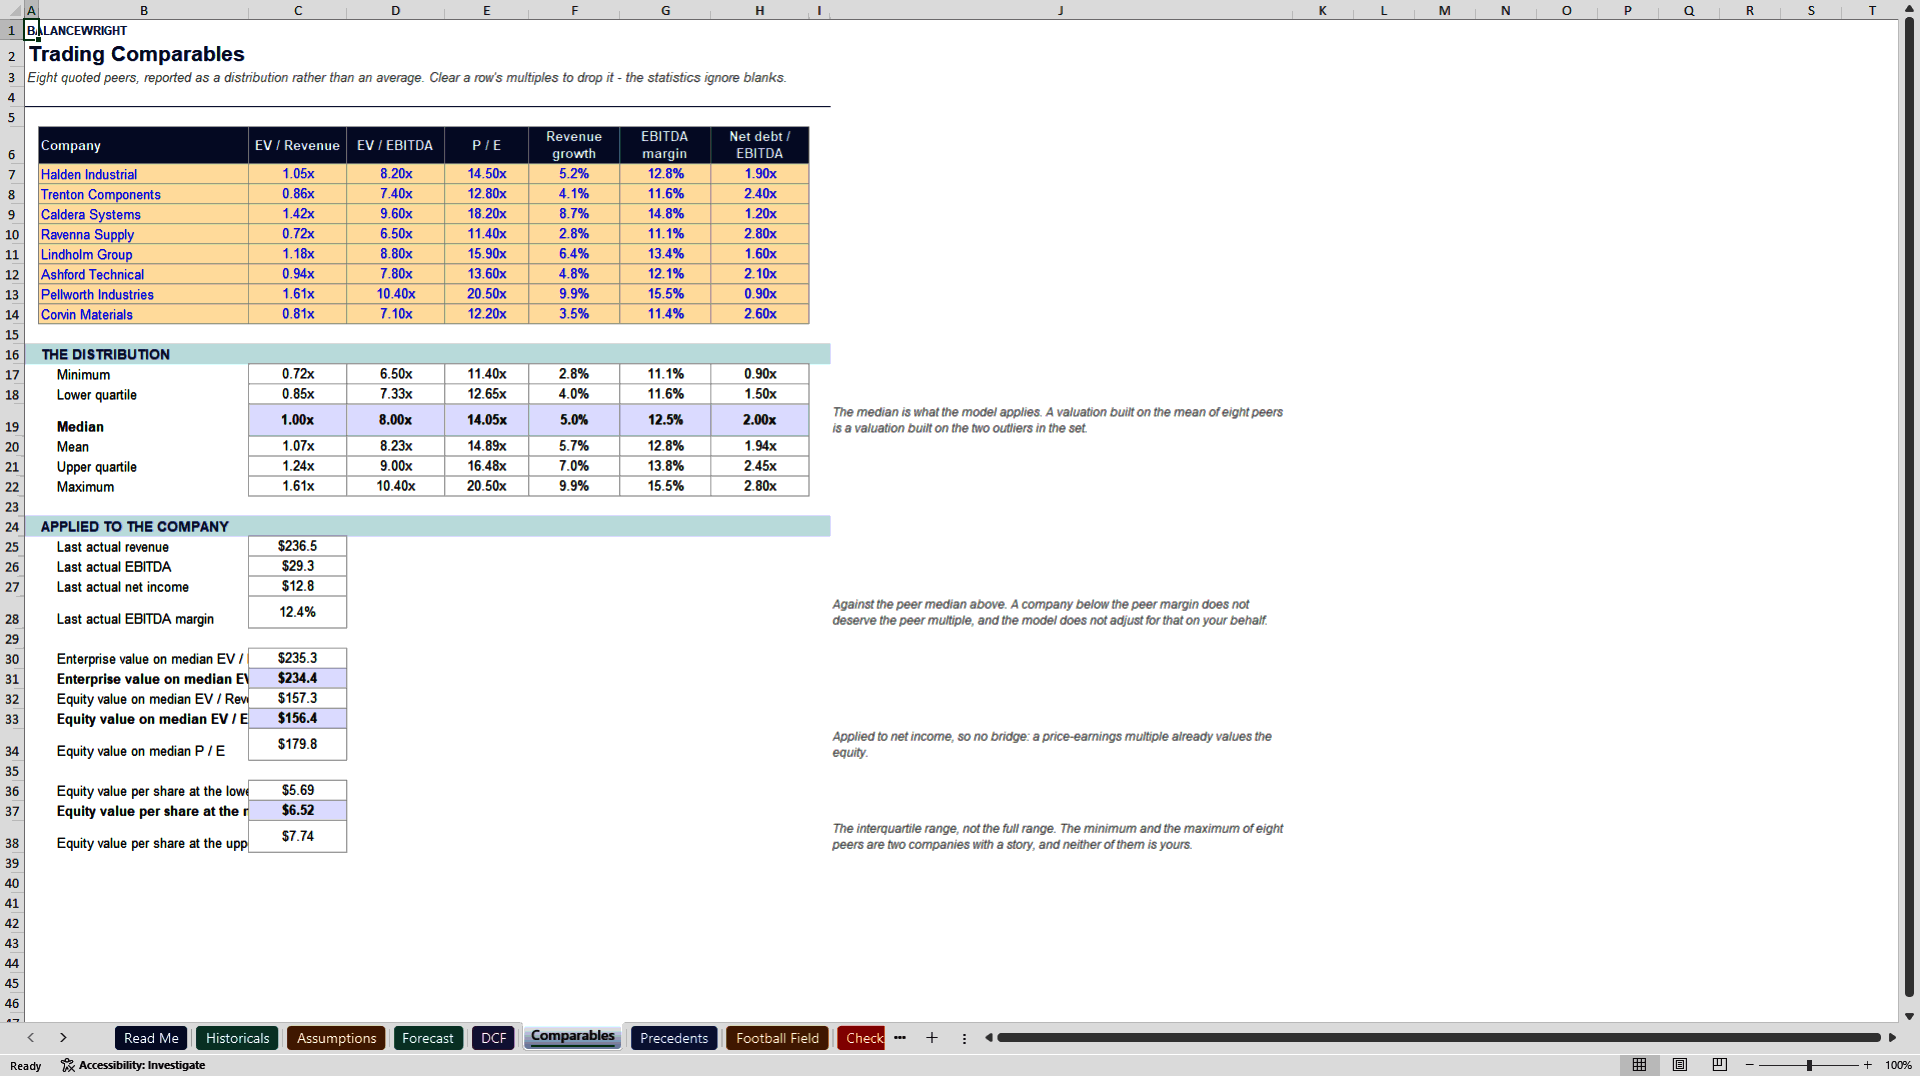
- Comparables reported as a distribution - minimum, quartiles, median, mean, maximum - with the median applied and the range run at the quartiles, because the mean of eight peers is the two outliers in the set.
FINANCIAL MODELING EXCEL DESCRIPTION
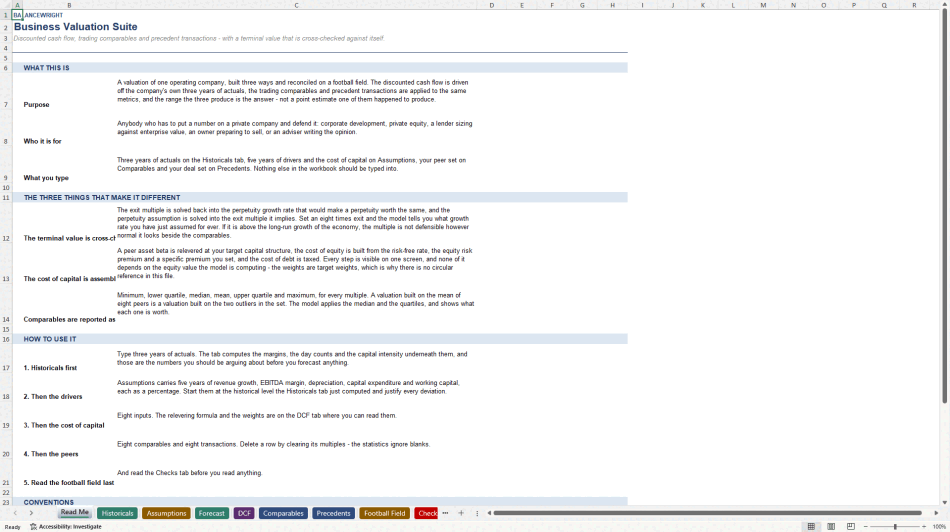
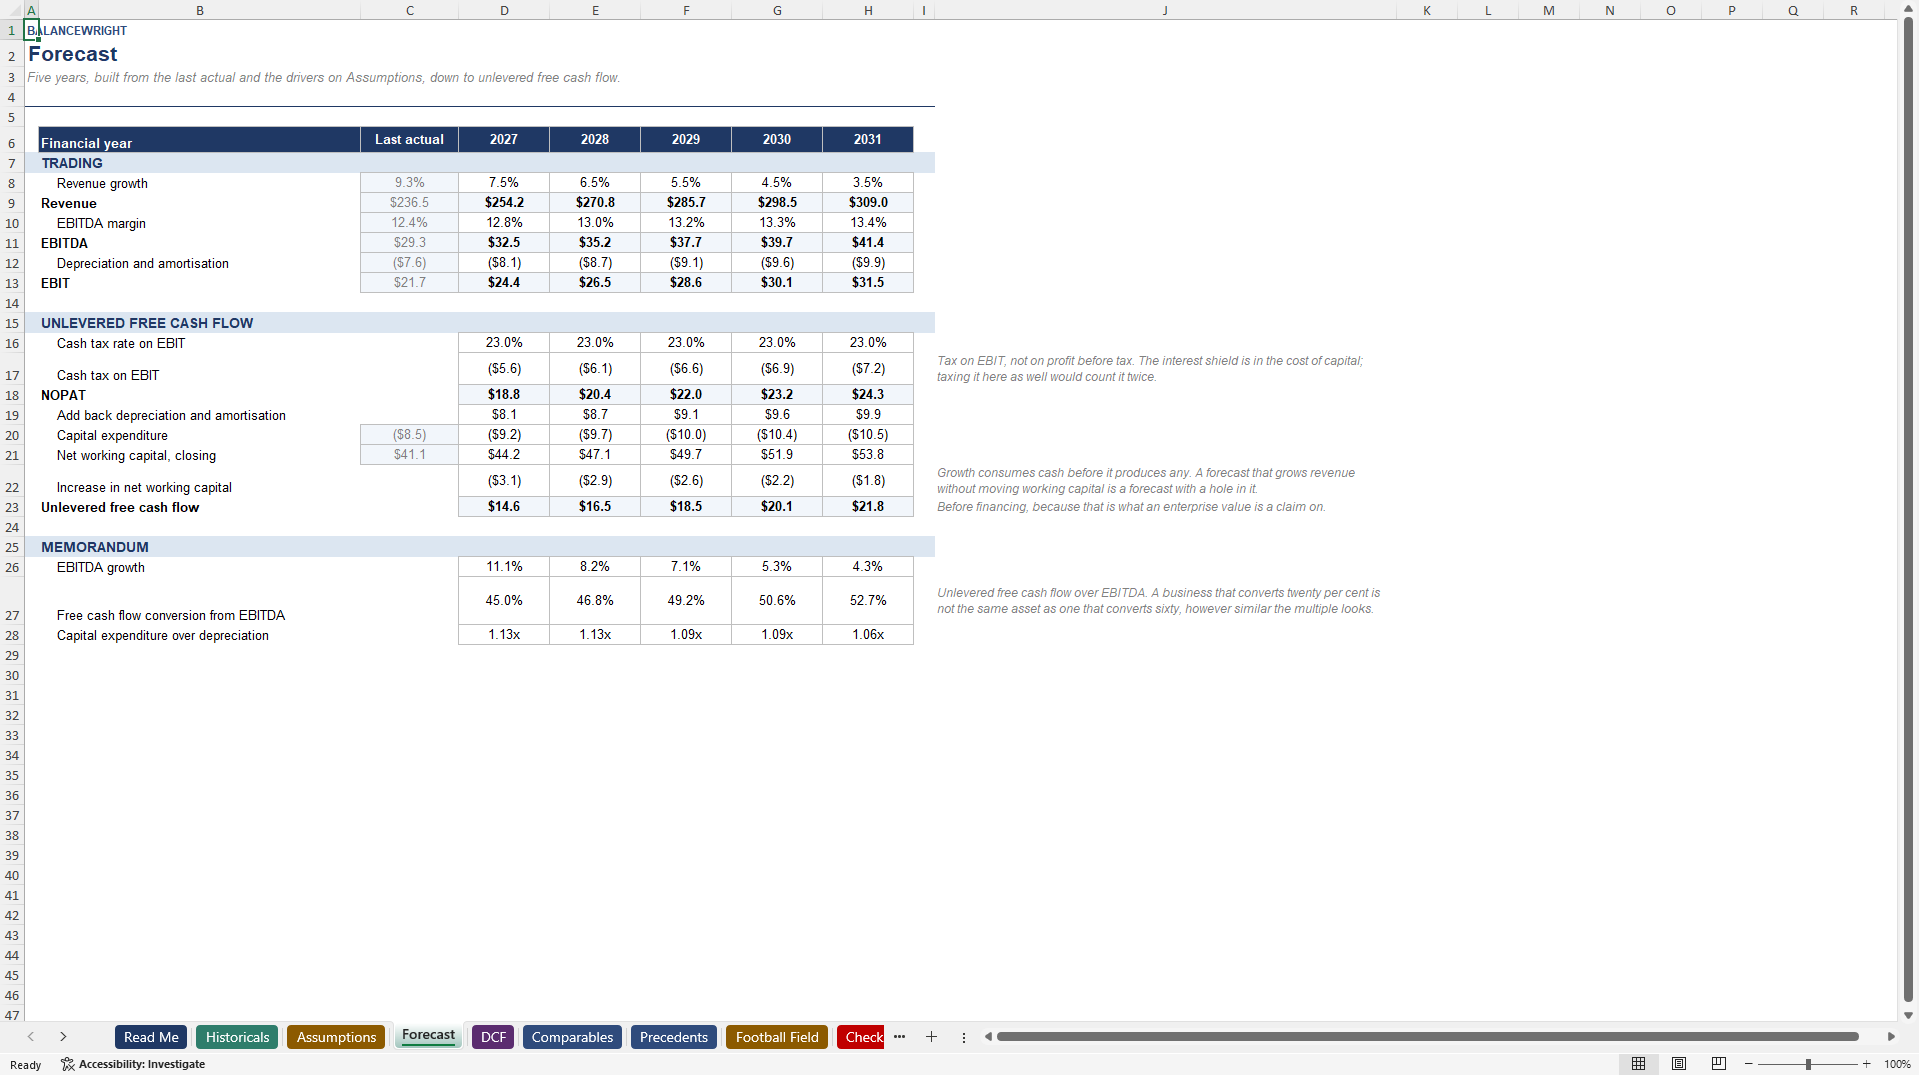
This workbook values one operating company three ways and reconciles them on a football field. The discounted cash flow is driven off the company's own three years of actuals rather than a set of drivers somebody invented; the trading comparables and the precedent transactions are applied to the same metrics; and the range the three produce is the answer, not a point estimate one of them happened to land on. Nine tabs, 434 live formulas, one worked example loaded and working the moment you open it.
WHY THIS ONE IS DIFFERENT. There are a lot of valuation templates, and almost all of them have the same two holes. The first is that the terminal value – seventy-three per cent of enterprise value in the worked example, and more in most models – is taken on trust. You type an exit multiple, the model multiplies, and nothing in the file ever asks whether that multiple is consistent with anything else you have assumed. The second is that the comparables are averaged: eight peers, one arithmetic mean, and the two companies with a story quietly set the valuation.
THE TERMINAL VALUE IS CROSS-CHECKED IN BOTH DIRECTIONS. Set a 7.5 times exit and the model tells you that you have just assumed 2.69 per cent growth for ever, and whether that sits inside the band you set. Set 2.25 per cent perpetual growth and it tells you that implies a 7.04 times exit. When those two numbers are far apart, the two halves of your valuation are not describing the same company – and check 15 says so. Raise the exit multiple far enough and check 13 fails while every other number in the file still looks reasonable.
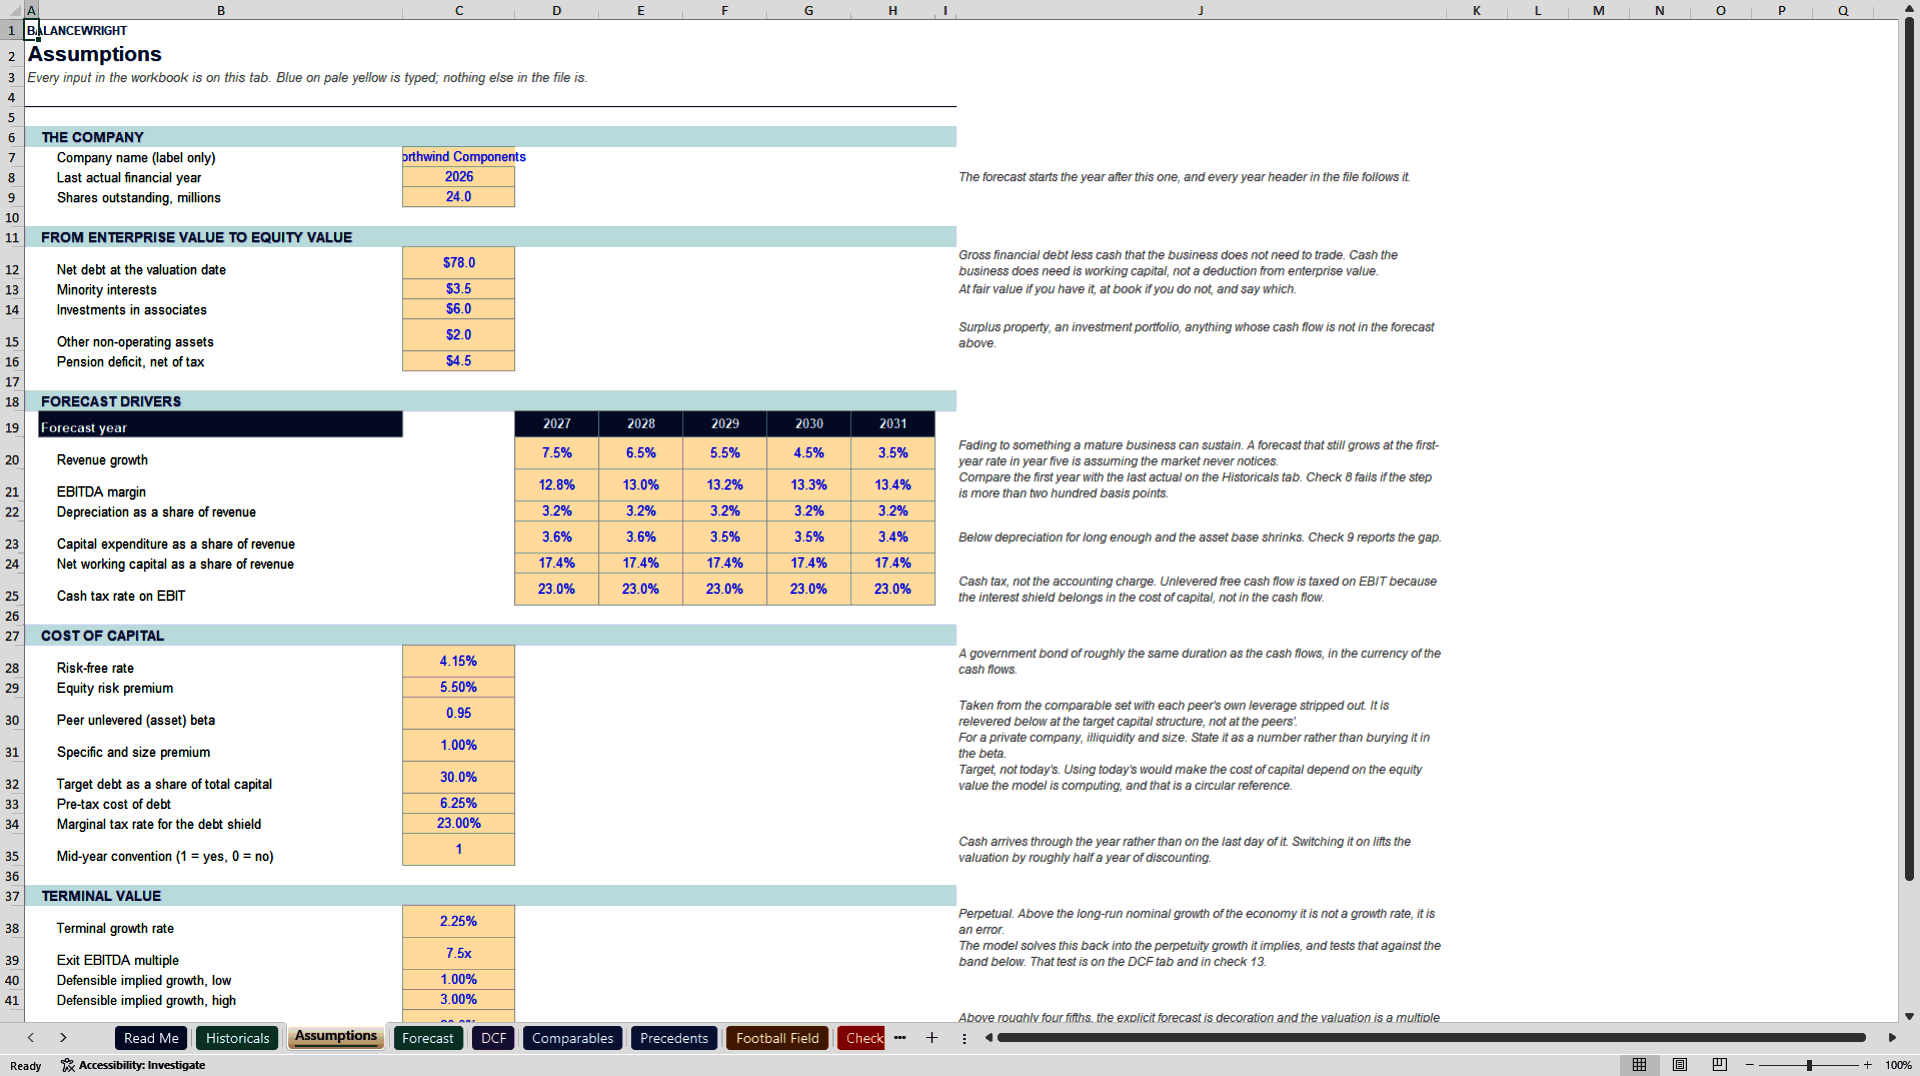
THE COST OF CAPITAL IS ASSEMBLED, NOT TYPED. A peer asset beta relevered at your target capital structure through the Hamada formula, a cost of equity built from the risk-free rate, the equity risk premium and an explicit specific premium, and a cost of debt that is taxed. Eight inputs, seven visible steps, one number at the bottom. It uses target weights rather than today's, which is why nothing in this file is circular – and the note beside the row says so.
COMPARABLES ARE A DISTRIBUTION, NOT AN AVERAGE. Every multiple gets six statistics: minimum, lower quartile, median, mean, upper quartile, maximum. The valuation runs at the median and the range at the quartiles, because the minimum and the maximum of eight peers are two companies with a story and neither of them is yours. Beside each peer's multiples sit its revenue growth, EBITDA margin and leverage, so you can see why one trades at 6.5 times and another at 10.4.
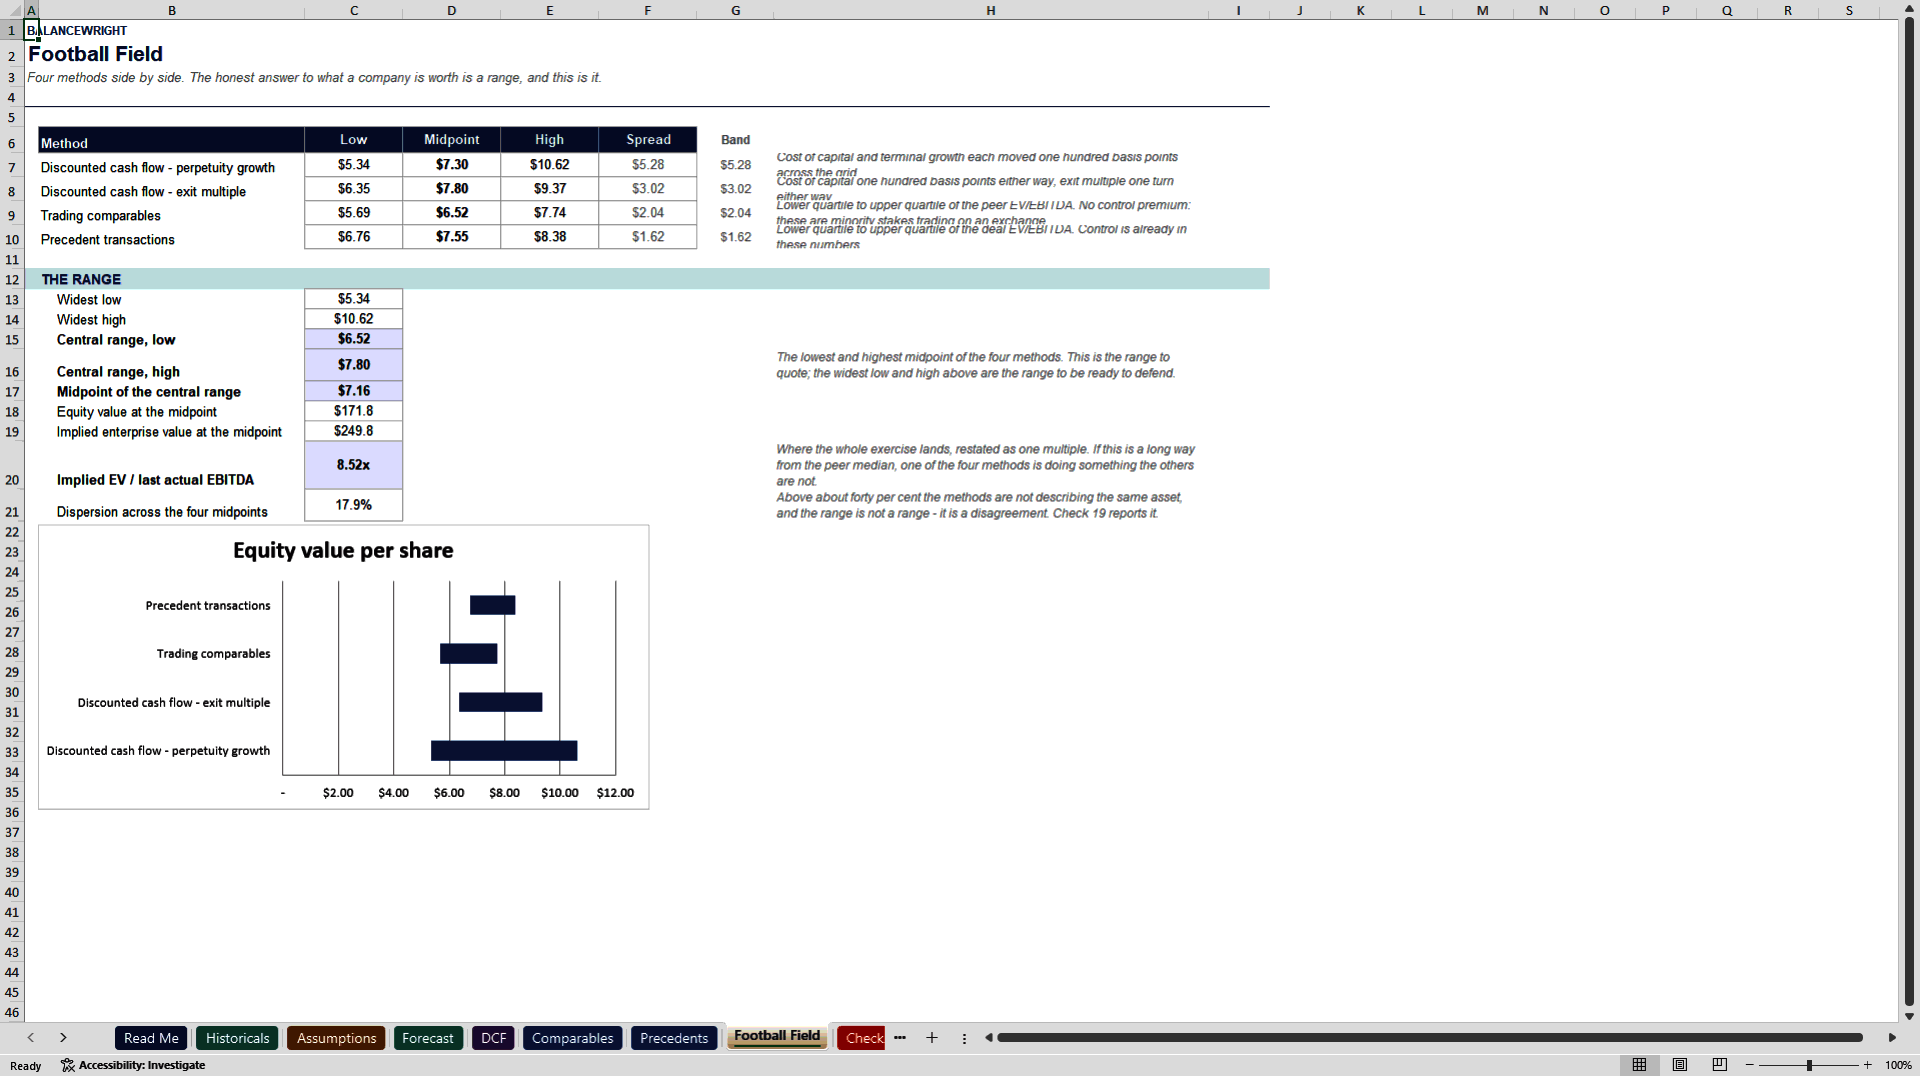
THE FOOTBALL FIELD. Four methods, each with a low, a midpoint and a high, drawn as floating bars rather than listed as numbers. The two discounted cash flow rows move the cost of capital one hundred basis points either way and the terminal assumption one step either way; the two market rows run from the lower quartile to the upper quartile. The central range is the lowest and highest of the four midpoints – the range to quote. The widest low and high are the range to be ready to defend. And a dispersion line measures how far apart the four methods actually are: above about forty per cent they are not describing the same asset, and what you have is not a range but a disagreement.
TWO SENSITIVITY GRIDS. Cost of capital against terminal growth, and cost of capital against the exit multiple, both as equity value per share. Nothing here is an Excel data table: all fifty cells are ordinary formulas recomputed from the same cash flows the DCF uses, so nothing has to be refreshed and nothing goes stale. Checks 20 and 21 test that the centre cell of each grid equals the model beside it.
TWENTY-TWO CHECKS. Some are arithmetic that has to hold: the bridge from enterprise value to equity value recomputed from the assumptions, the relevering formula recomputed from the inputs, unlevered free cash flow equal to its five components. Others are judgement made testable: the first forecast margin within two hundred basis points of the last actual, capital expenditure covering depreciation across the forecast, the terminal value under the share of enterprise value you will accept, and the four methods disagreeing by less than forty per cent.
TABS: Read Me, Historicals, Assumptions, Forecast, DCF, Comparables, Precedents, Football Field, Checks.
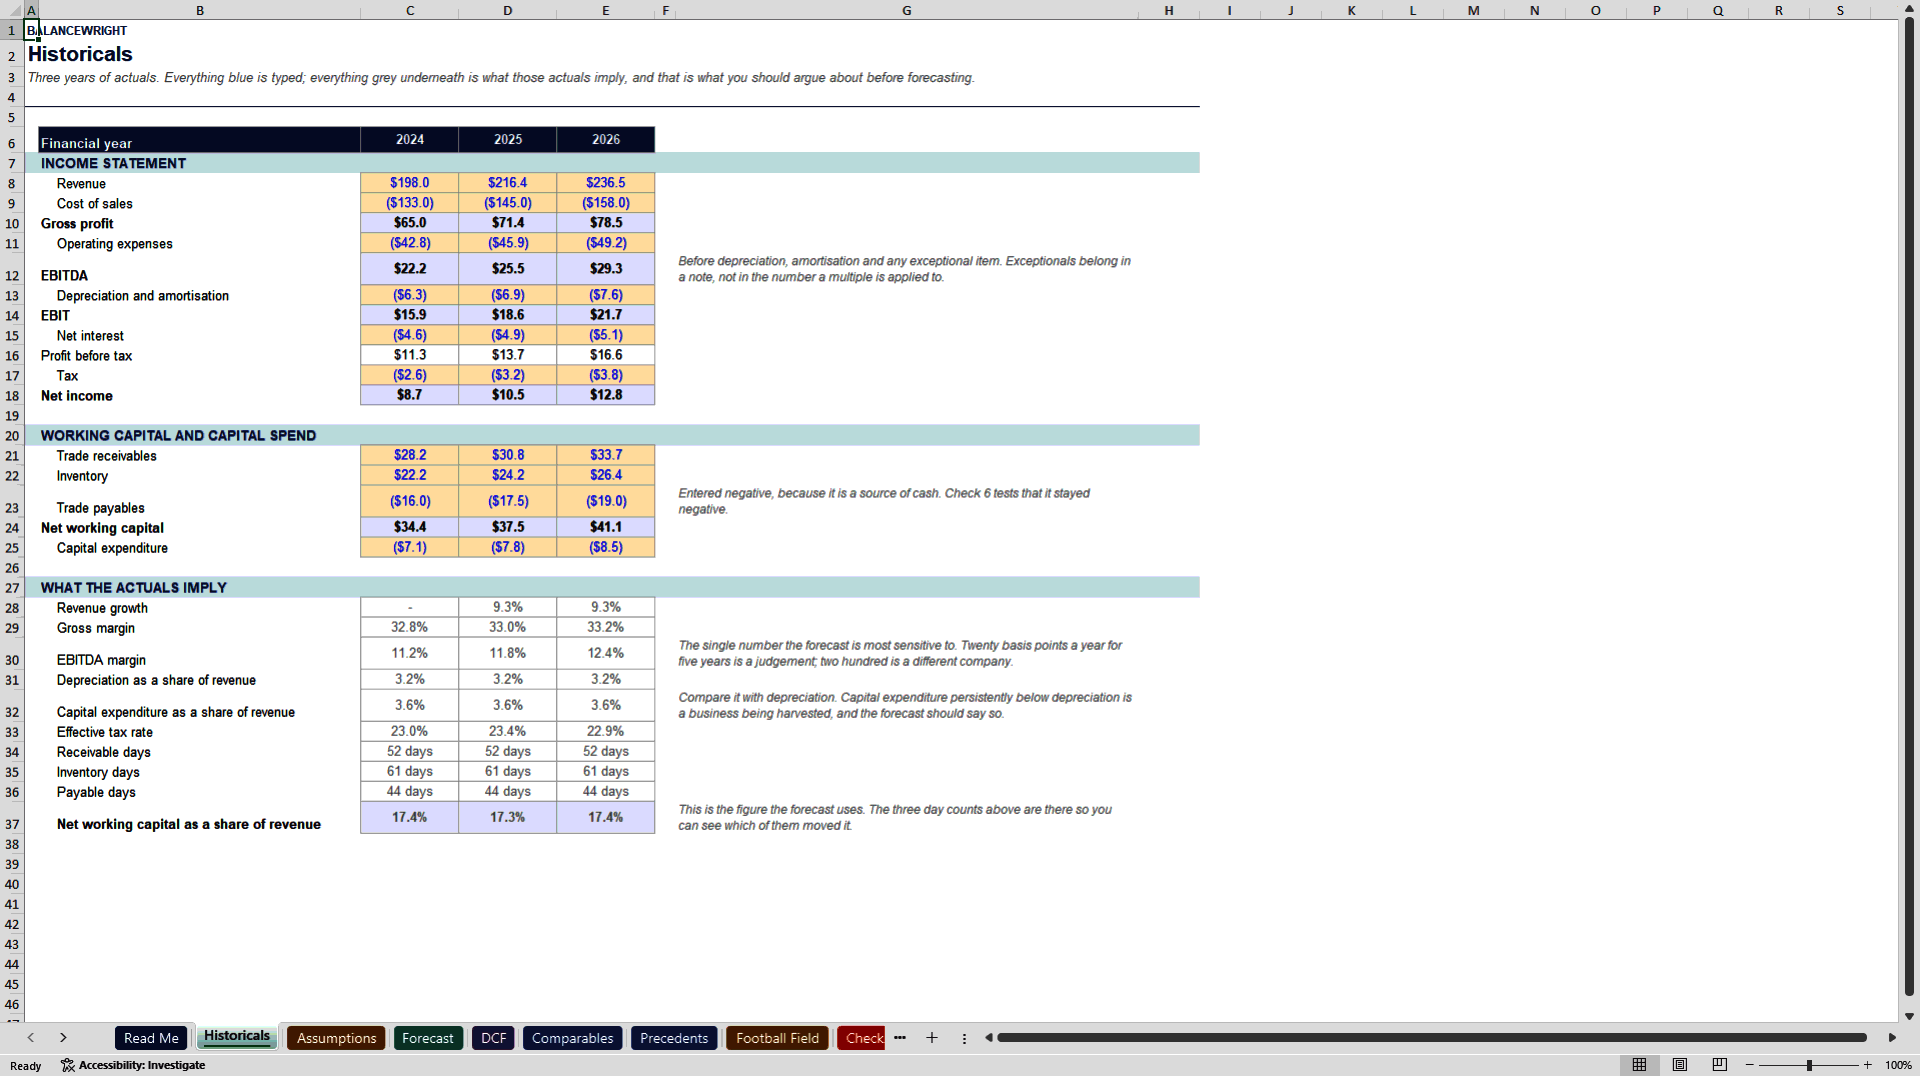
HISTORICALS COME FIRST. Three years of actuals go in at the top, and underneath them the model computes what those actuals imply: revenue growth, gross and EBITDA margin, depreciation and capital expenditure as a share of revenue, the effective tax rate, and receivable, inventory and payable days. Those are the numbers you should be arguing about before you forecast anything, and they are where your drivers should start.
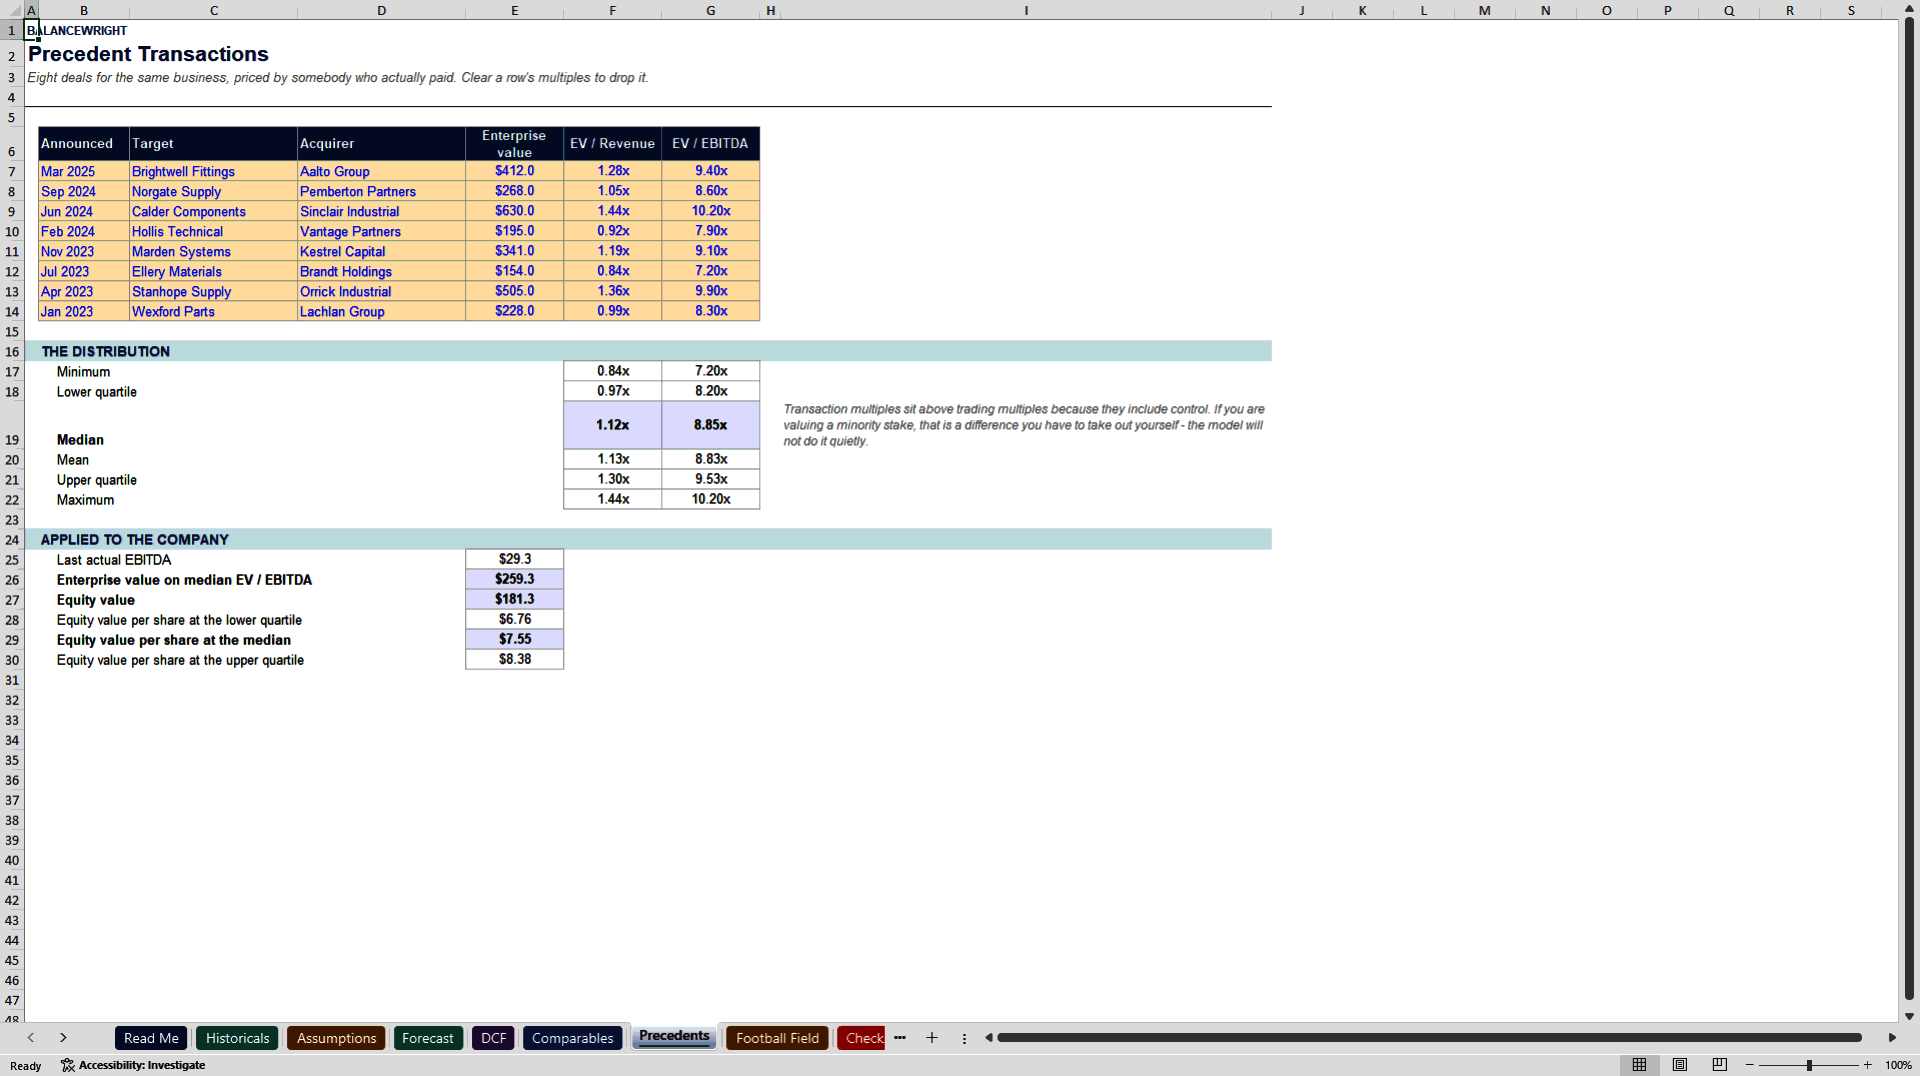
WORKED EXAMPLE: Northwind Components – $236.5m of revenue, a 12.4 per cent EBITDA margin, $78m of net debt and 24m shares. Cost of capital 9.91 per cent from a 0.95 asset beta relevered at a 30 per cent target debt share. Enterprise value $265.2m on the exit multiple and $253.2m on the perpetuity, against a trading median of 8.0 times and a deal median of 8.85 times. The four methods land between $6.52 and $7.80 a share, a midpoint of $7.16, and an implied 8.52 times last actual EBITDA.
WHAT YOU CHANGE: three years of actuals on Historicals; share count and the five bridge items; five years of six drivers; eight cost-of-capital inputs; four terminal value inputs; eight peers and eight deals. Clear a peer's multiples and it drops out of the statistics without breaking anything.
HOW IT IS BUILT: Microsoft Excel (.xlsx). No macros, no add-ins, no external links, no password protection, no locked cells, and iterative calculation off. Every figure was independently re-derived before publication: the whole valuation was rebuilt in a second implementation and compared to the workbook in 153 separate tests, including all fifty sensitivity cells and the quartile statistics, which were reimplemented from the definition rather than by calling Excel.
WHAT THIS MODEL IS NOT: not a leveraged buyout model – no debt schedule, no sponsor return, no exit waterfall. Not a merger model – one company, no accretion and dilution, no synergies. Not a sum of the parts. It does not adjust peer multiples for size, growth or margin differences; it puts those differences next to the multiples and leaves the judgement with you, because an automatic adjustment nobody can see is worse than none.
A 10-page guide and preview PDF is included with the download.
Got a question about the product? Email us at support@flevy.com or ask the author directly by using the "Ask the Author a Question" form. If you cannot view the preview above this document description, go here to view the large preview instead.
Source: Best Practices in Financial Modeling, Valuation Excel: Business Valuation Model: DCF, Comps & Football Field Excel (XLSX) Spreadsheet, Balancewright
ABOUT THE AUTHOR

Balancewright builds working financial models for subscription and recurring-revenue businesses -- cohort retention, revenue movement, unit economics, cash flow and scenario forecasting.
Every model is formula-driven end to end. No locked cells, no passwords, no macros and no external links, so any calculation can be inspected, adapted and audited. Each file ships with a visible
... [read more]
Ask the Author a Question
You must be logged in to contact the author.




























