

Fishbone Diagram (Excel XLS)
Excel (XLS) FlevyPro Document
Sorry, this document is currently only available to FlevyPro subscribers.
You can join FlevyPro for only $39/month.
DESCRIPTION
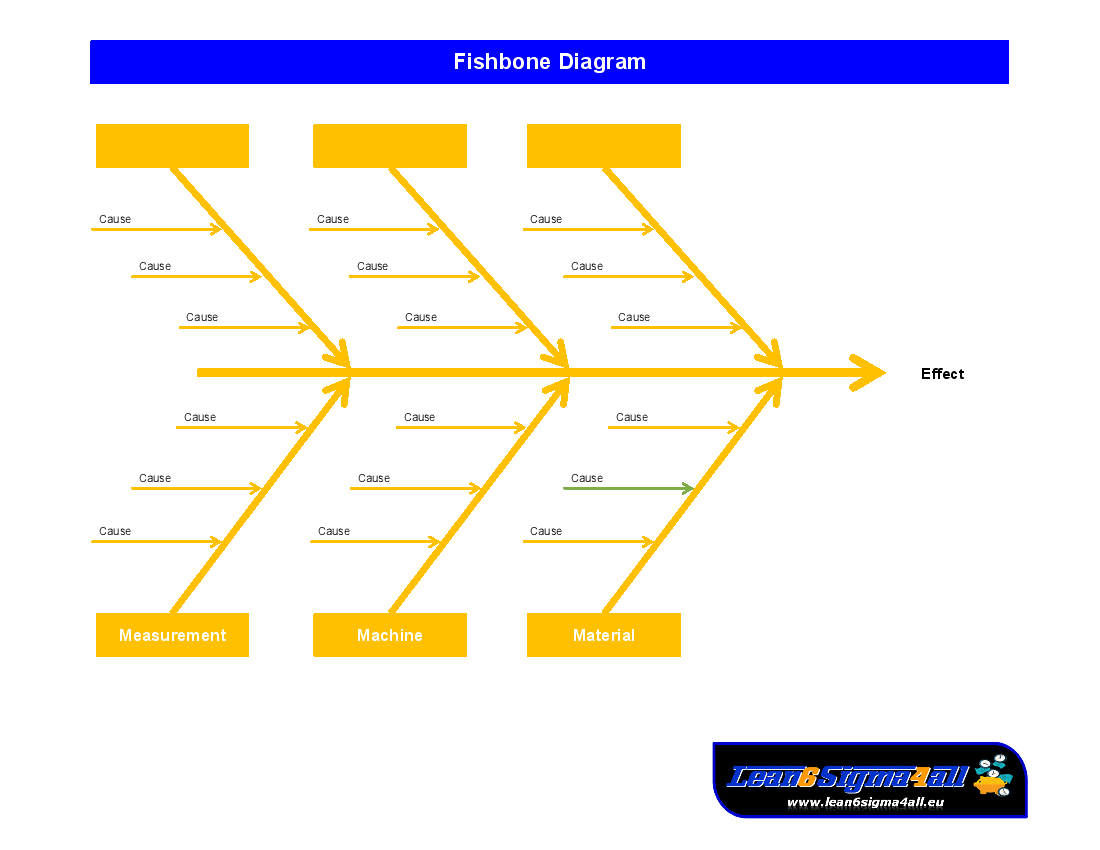
A Cause and Effect Diagram is structured brainstorming tool designed to assist an improvement team in listing potential causes of a specific effect. It is also known as an Ishikawa Diagram, for its creator, or a Fishbone Diagram, for its resemblance to the bones of a fish. Causes are often grouped into major categories, which are classically defined as the 6 Ms: Man/Mind Power (people), Methods (processes), Machines (technology), Materials (raw materials, information, consumables), Measurements (inspection), and Milieu/Mother Nature (environment). An additional 2 Ms are also sometimes used: Management/Money Power and Maintenance.
This template was created by Lean6Sigma4All. Lean6Sigma4All is a matchmaking platform that aims to connect anyone interested in Lean Six Sigma with any LSS expert, consultant, or agency.
Got a question about the product? Email us at flevypro@flevy.com.
Source: Best Practices in Lean Template, Fishbone Diagram Excel: Fishbone Diagram Excel (XLS) Spreadsheet, Flevy
Sorry, this document is currently only available to FlevyPro subscribers.
You can join FlevyPro for only $39/month.
Did you need more documents?
Consider a FlevyPro subscription from $39/month. View plans here.
