
Oil & Gas Financial Model – DCF and NAV Valuation (5+ Yrs.) (Excel XLSX)
Excel (XLSX)
BENEFITS OF THIS EXCEL DOCUMENT
- Informed Decision Making: The Oil and Gas financial model empowers stakeholders to make data-driven decisions regarding project investment, resource allocation, and risk management.
- Investment Attractiveness: DCF and NAV valuations provide insights into the project's economic viability, helping attract investors and secure financing.
- DCF and NAV Valuation: The model employs Discounted Cash Flow (DCF) and Net Asset Value (NAV) valuation methods to assess project economics and investment viability.
OIL & GAS EXCEL DESCRIPTION
The Oil and Gas financial model with DCF (Discounted Cash Flow) and NAV (Net Asset Value) Valuation is a robust tool tailored to analyze the financial aspects of oil and gas exploration and production projects. It encompasses key components such as revenue projections, operating expenses, investment analysis, reserve estimation, and financial valuation methods. This model provides insights into project feasibility, investment attractiveness, and overall financial performance, enabling informed decision-making, risk assessment, and value optimization.
Key Components:
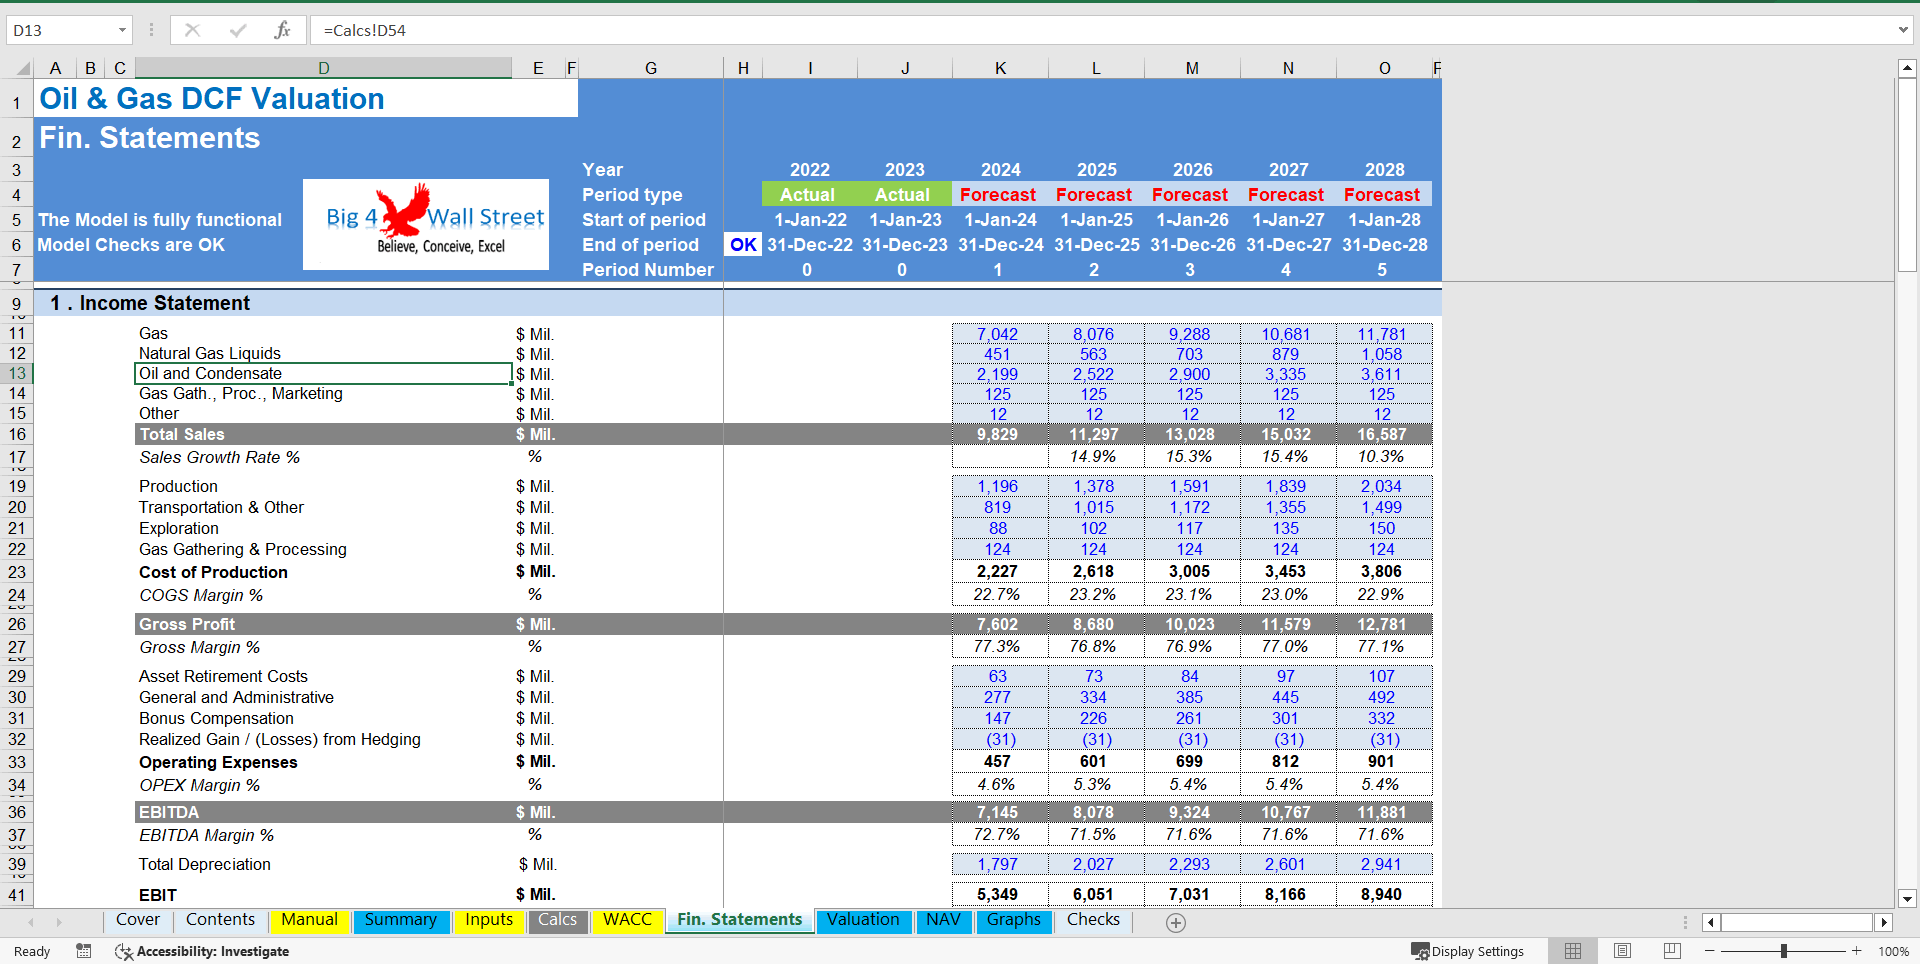
• Revenue Projections: The model assesses revenue sources from oil and gas production, factoring in production volumes and commodity prices.
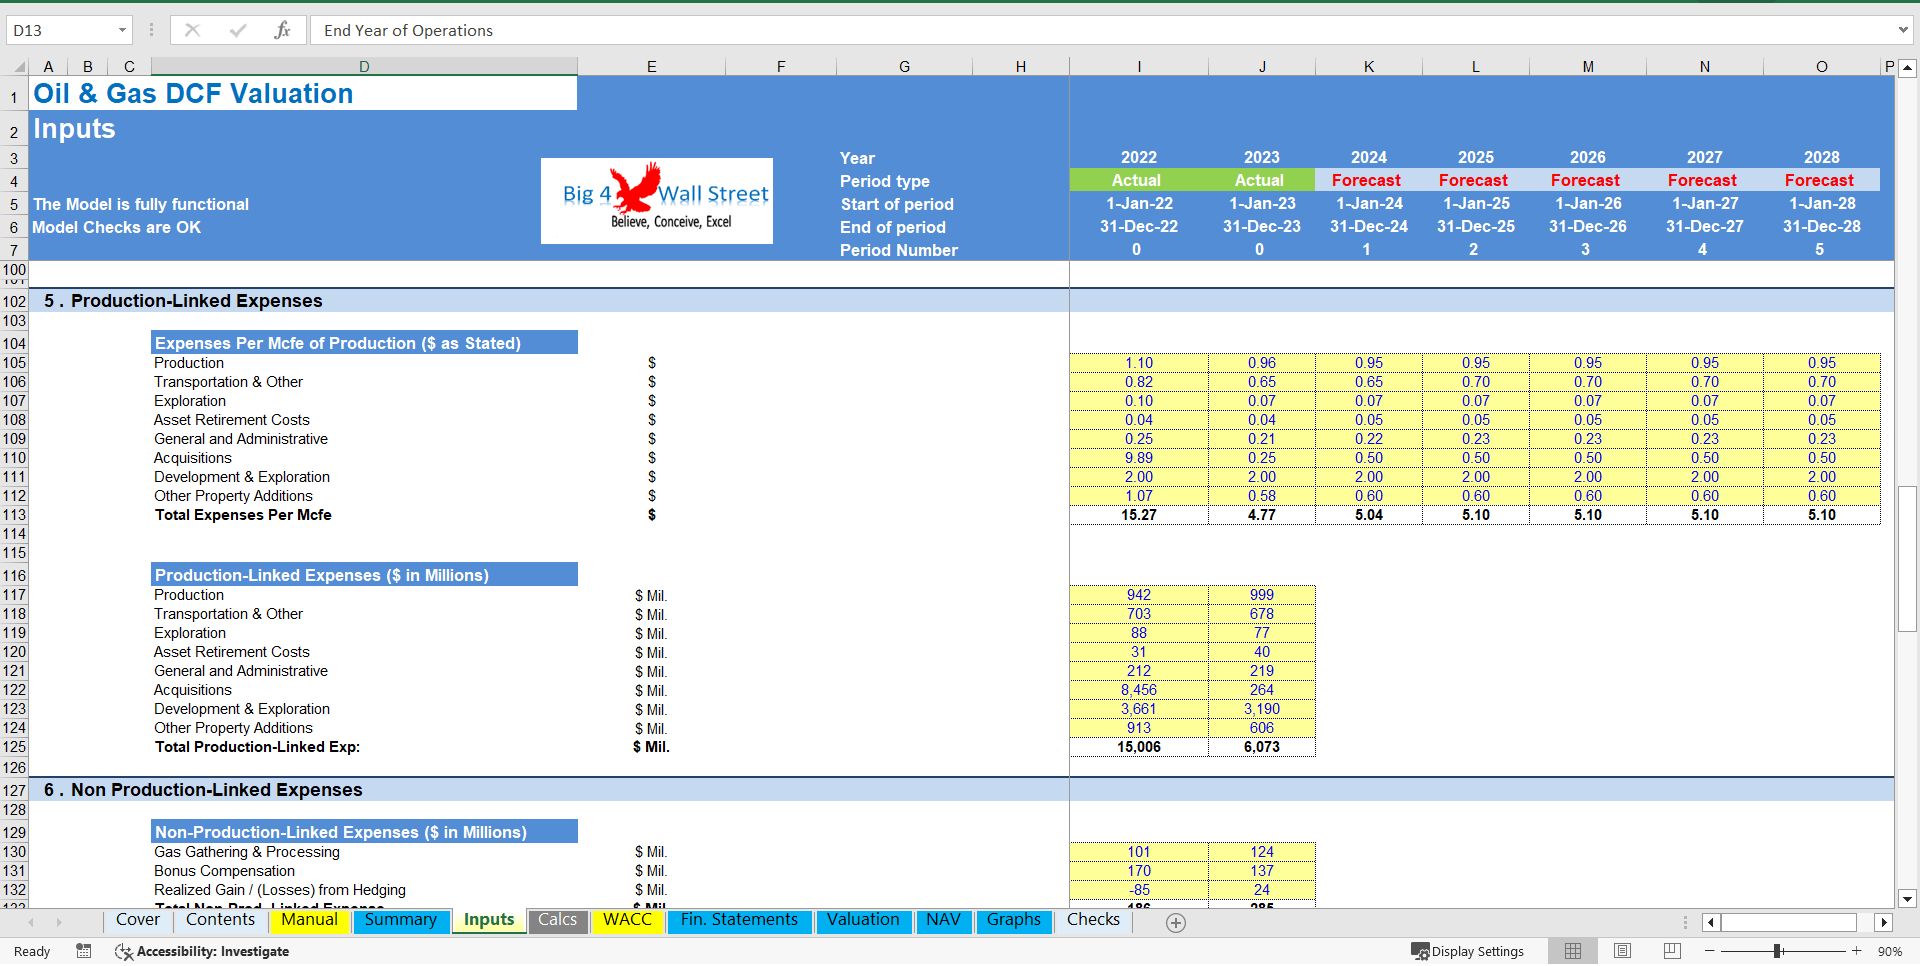
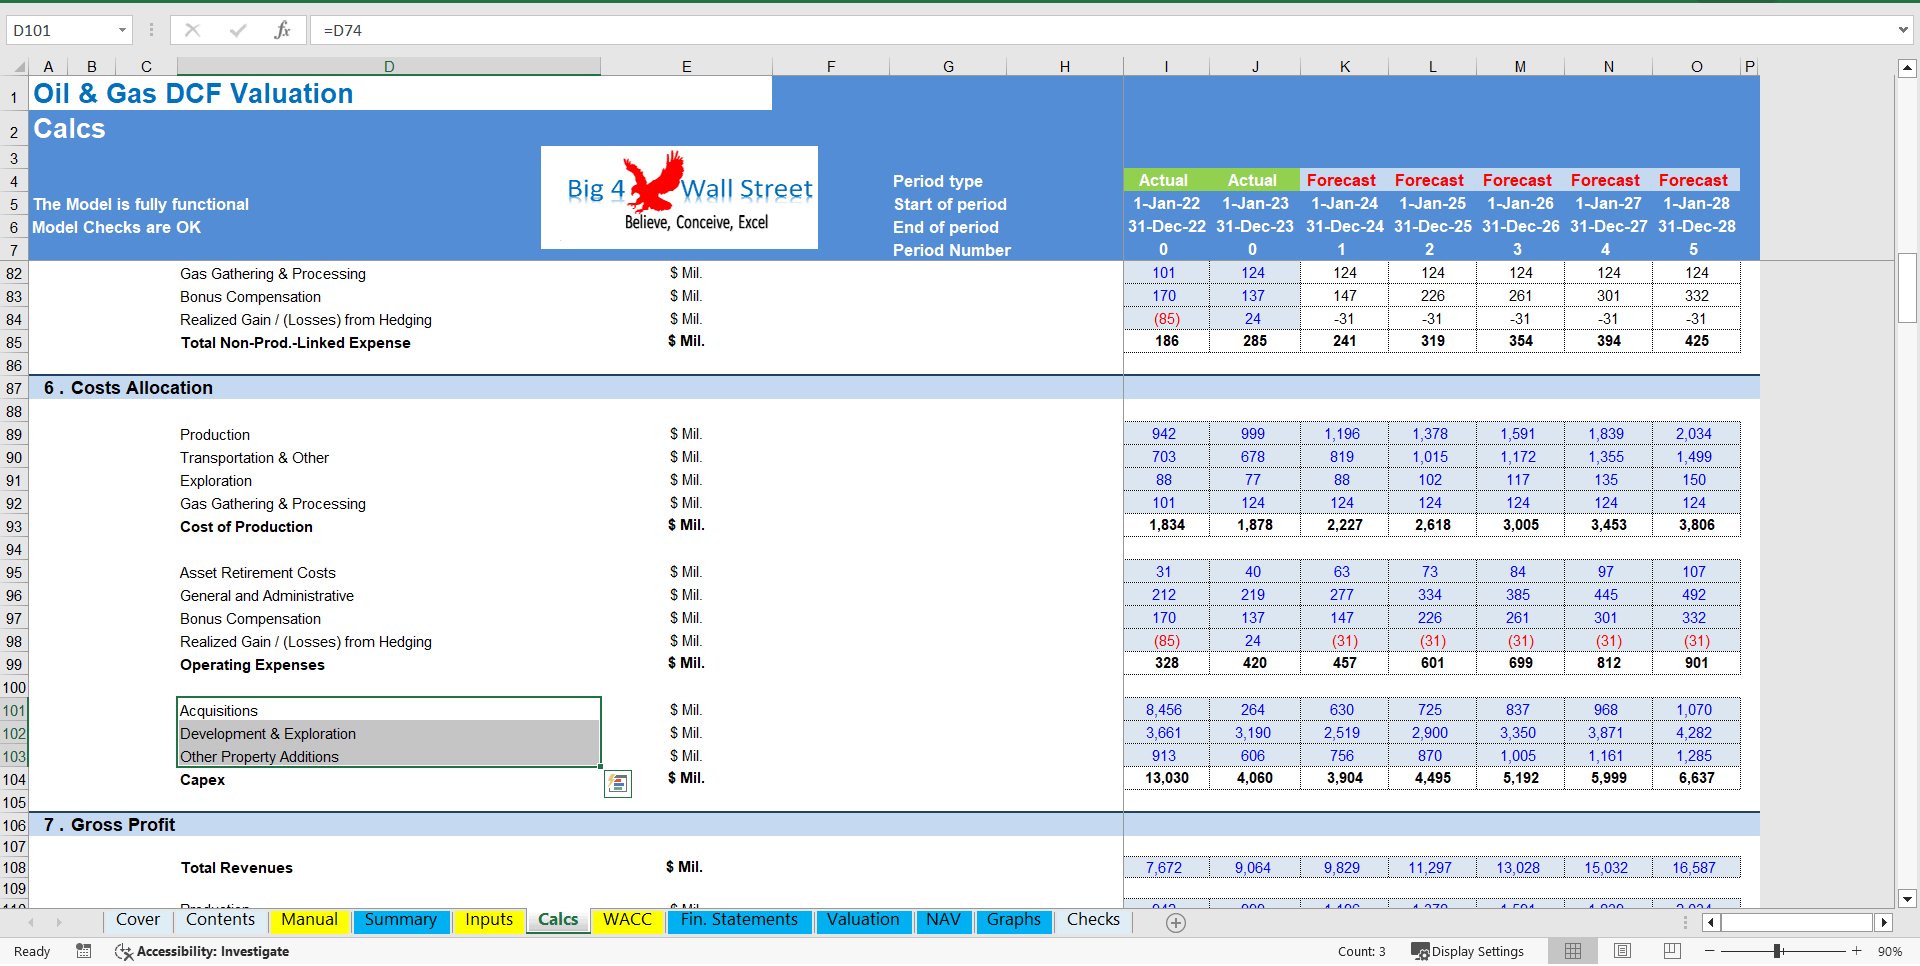
• Operating Expenses: It includes costs for drilling, production, transportation, royalties, taxes, and other operational expenditures associated with oil and gas operations.
• Investment Analysis: The model evaluates capital expenditures for acquisitions, development & exploration, other property additions, determining the project's initial investment and ongoing capital requirements.
• DCF and NAV Valuation: The model employs Discounted Cash Flow (DCF) and Net Asset Value (NAV) valuation methods to assess project economics and investment viability.
Key Benefits:
• Informed Decision Making: The Oil and Gas financial model empowers stakeholders to make data-driven decisions regarding project investment, resource allocation, and risk management.
• Risk Assessment: By considering production uncertainties, commodity price fluctuations, and operating costs, the model supports risk assessment and mitigation strategies.
• Investment Attractiveness: DCF and NAV valuations provide insights into the project's economic viability, helping attract investors and secure financing.
• Value Optimization: The model enables decision-makers to optimize project parameters, such as annual production, and capital expenditures, to maximize project value.
In summary, the Oil & Gas financial model with DCF and NAV Valuation is a valuable tool for evaluating the financial performance and investment attractiveness of oil and gas projects. It supports informed decision-making, risk assessment, and value optimization, contributing to the success and profitability of oil and gas exploration and production ventures.
——————————————————————————————————————————————————————————
MODEL GUIDELINES
So, a quick overview of the model, in the contents tab you can see the structure of the model and by clicking on any of the headlines to be redirected to the relevant worksheet.
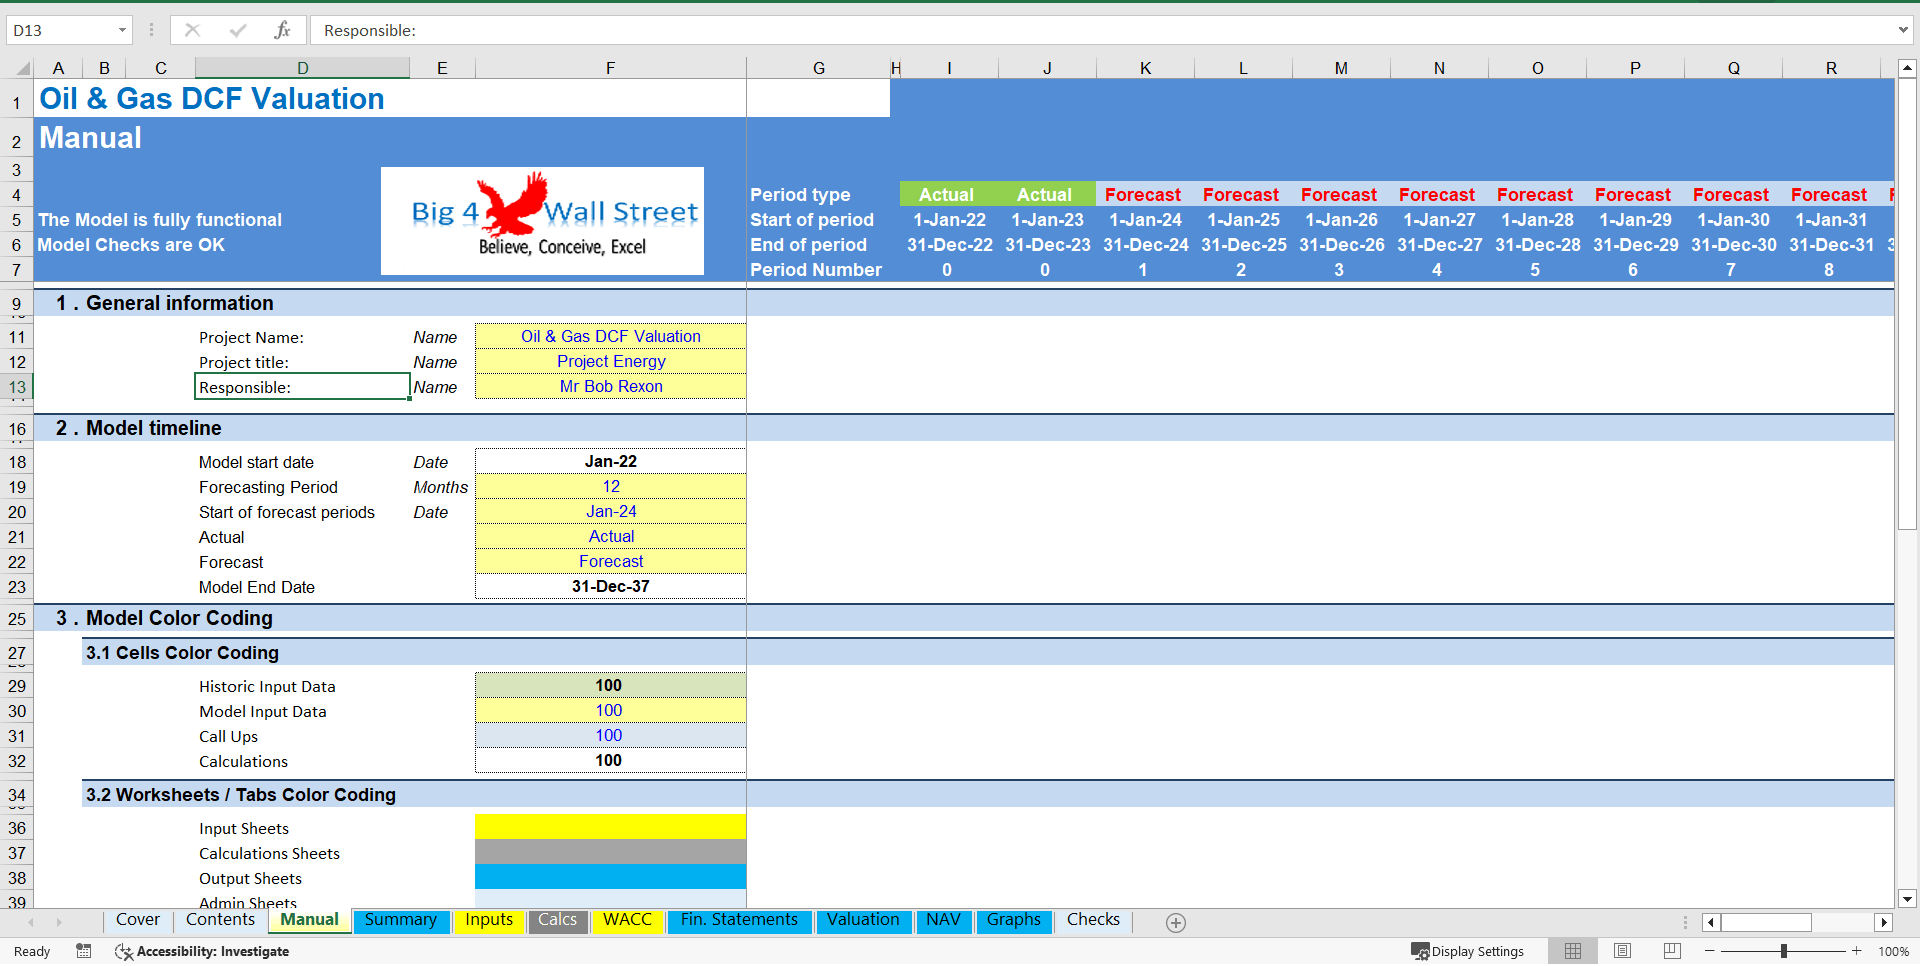
On the manual tab you can feed the general information for the model such as: project name & title, responsible, timeline of the model and date and currency conventions.
Additionally, there is a description of the color coding of the model in the same tab. Inputs are always depicted with a yellow fill and blue letters, call up (that is direct links from other cells) are filled in light blue with blue letters while calculations are depicted with white fill and black characters.
There is also color coding for the various tabs of the model. Yellow tabs are mostly assumptions tabs, grey tabs are calculations tabs, blue tabs are outputs tabs (that is effectively results or graphs) and finally light blue tabs are admin tabs (for example: the cover page, contents, and checks).
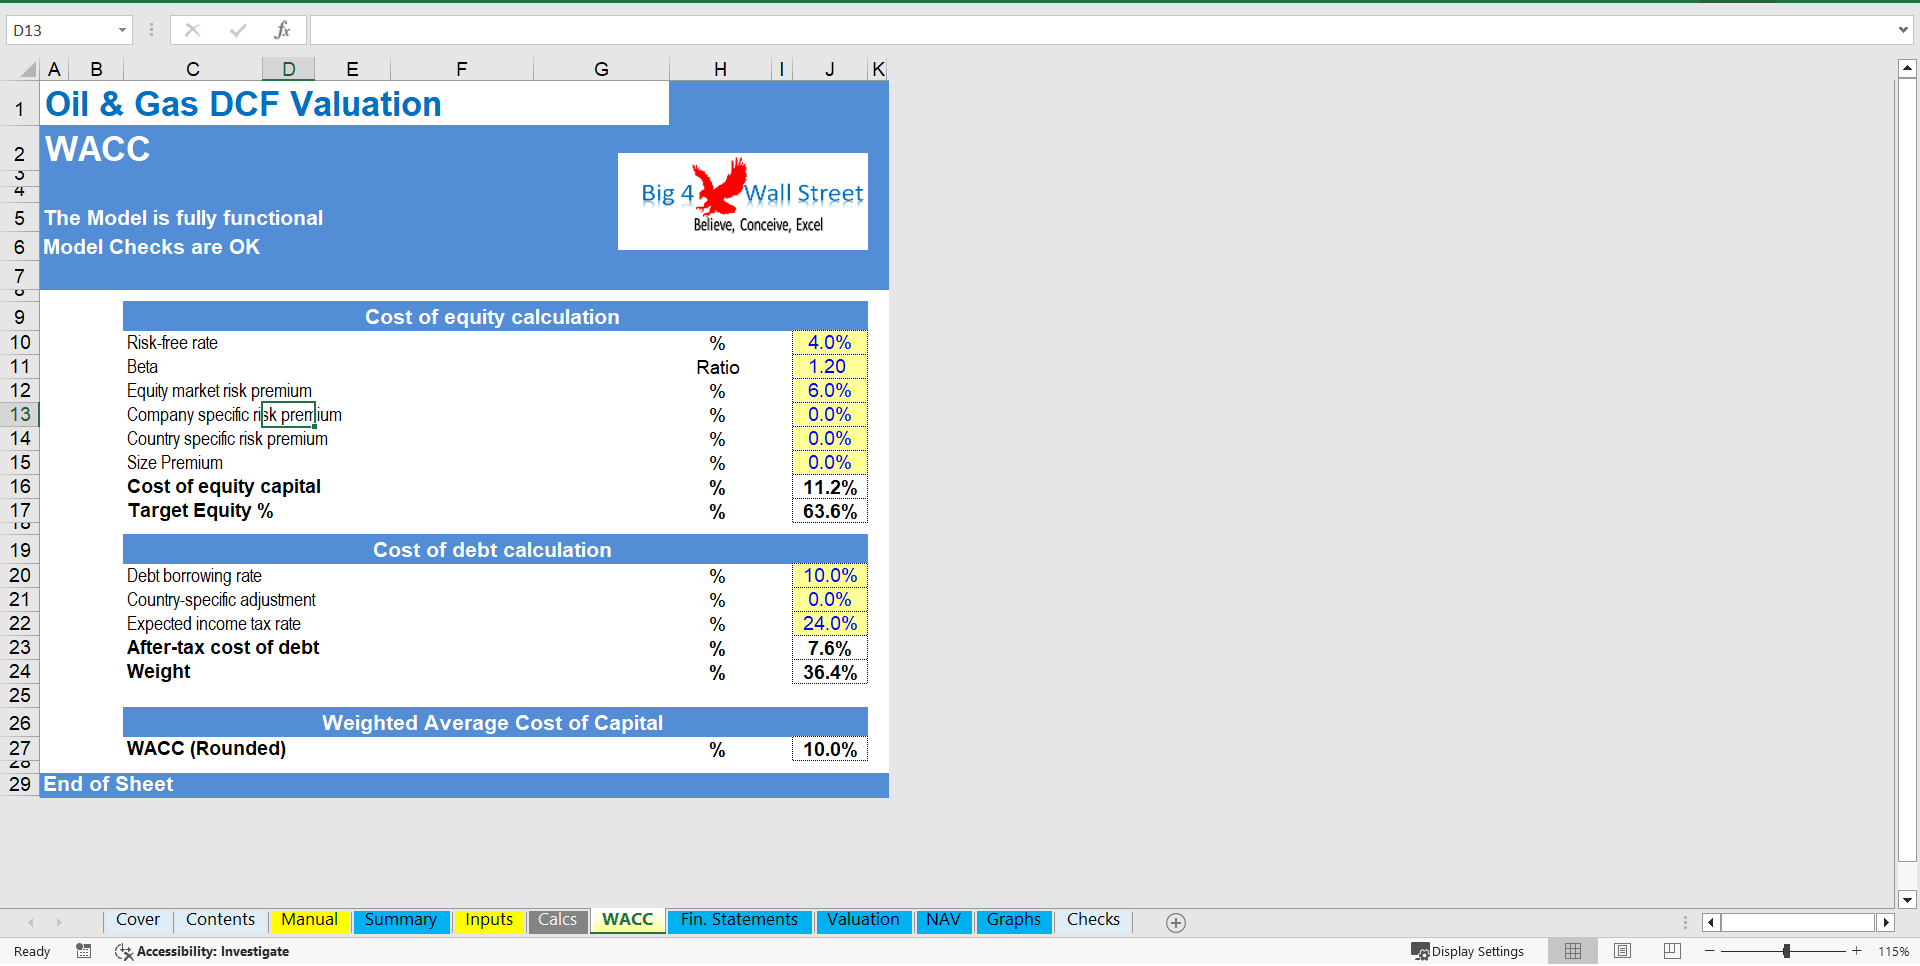
Moving on to the Inputs: detailed inputs for revenues such production, and commodity prices, pre hedging and post hedging prices, costs splits between production linked expenses and non-production linked expenses, working capital (receivables, payables, and other assets and liabilities), fixed assets and capex (split into initial investment and new maintenance capex), debt & equity financing as well as valuation assumptions (such as discount rates used in the weighted average cost of capital).
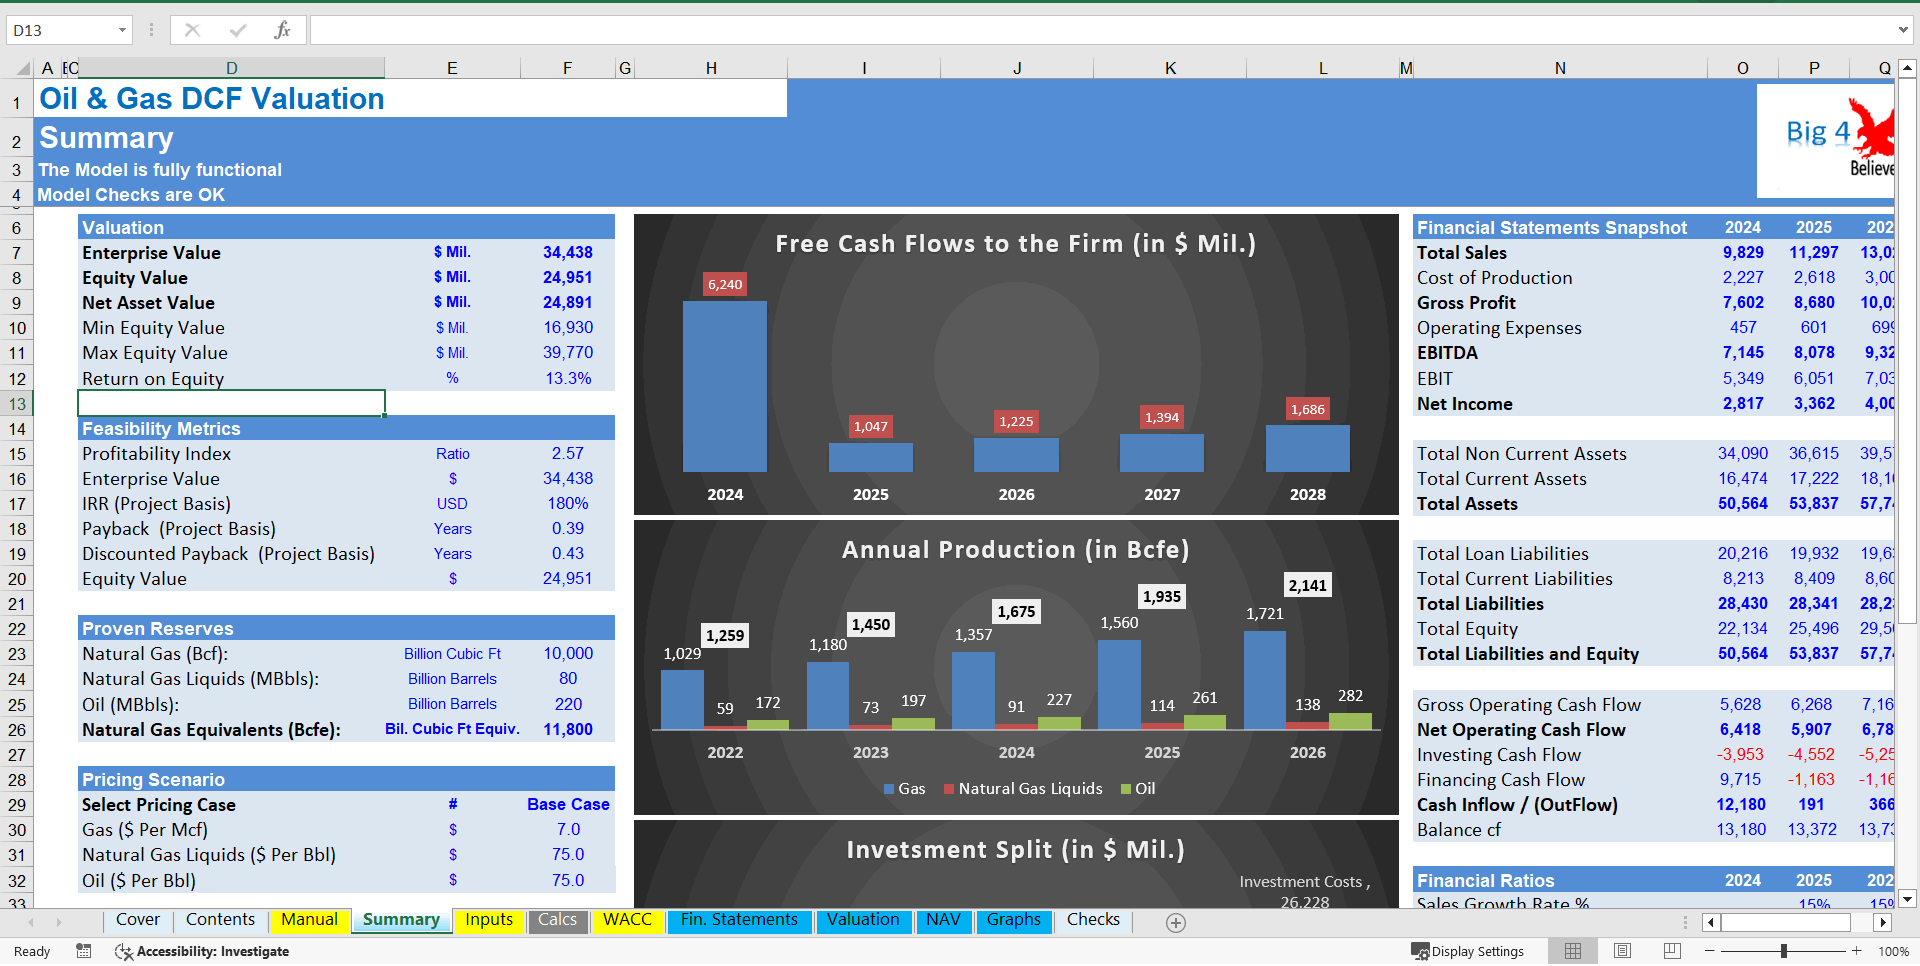
In the summary tab you can see a high-level report with the main metrics and value drivers of the model. It can be readily printed on one page for your convenience.
Calculations: this is where all calculations are performed. The revenues are calculated and deducting the operating costs adjusted for inflation the operating profit is resulting. Based on the assets financed and the gearing of the financing the interest and depreciation are occurring. By using the working capital assumptions, the impact of the business cycle is presented. Finally, depending on the level of the investment considered the relevant debt financing is calculated (Long term debt and overdraft).
In the Outputs tab: everything is aggregated here into the relevant statements: profit and loss, balance sheet and cash flow.
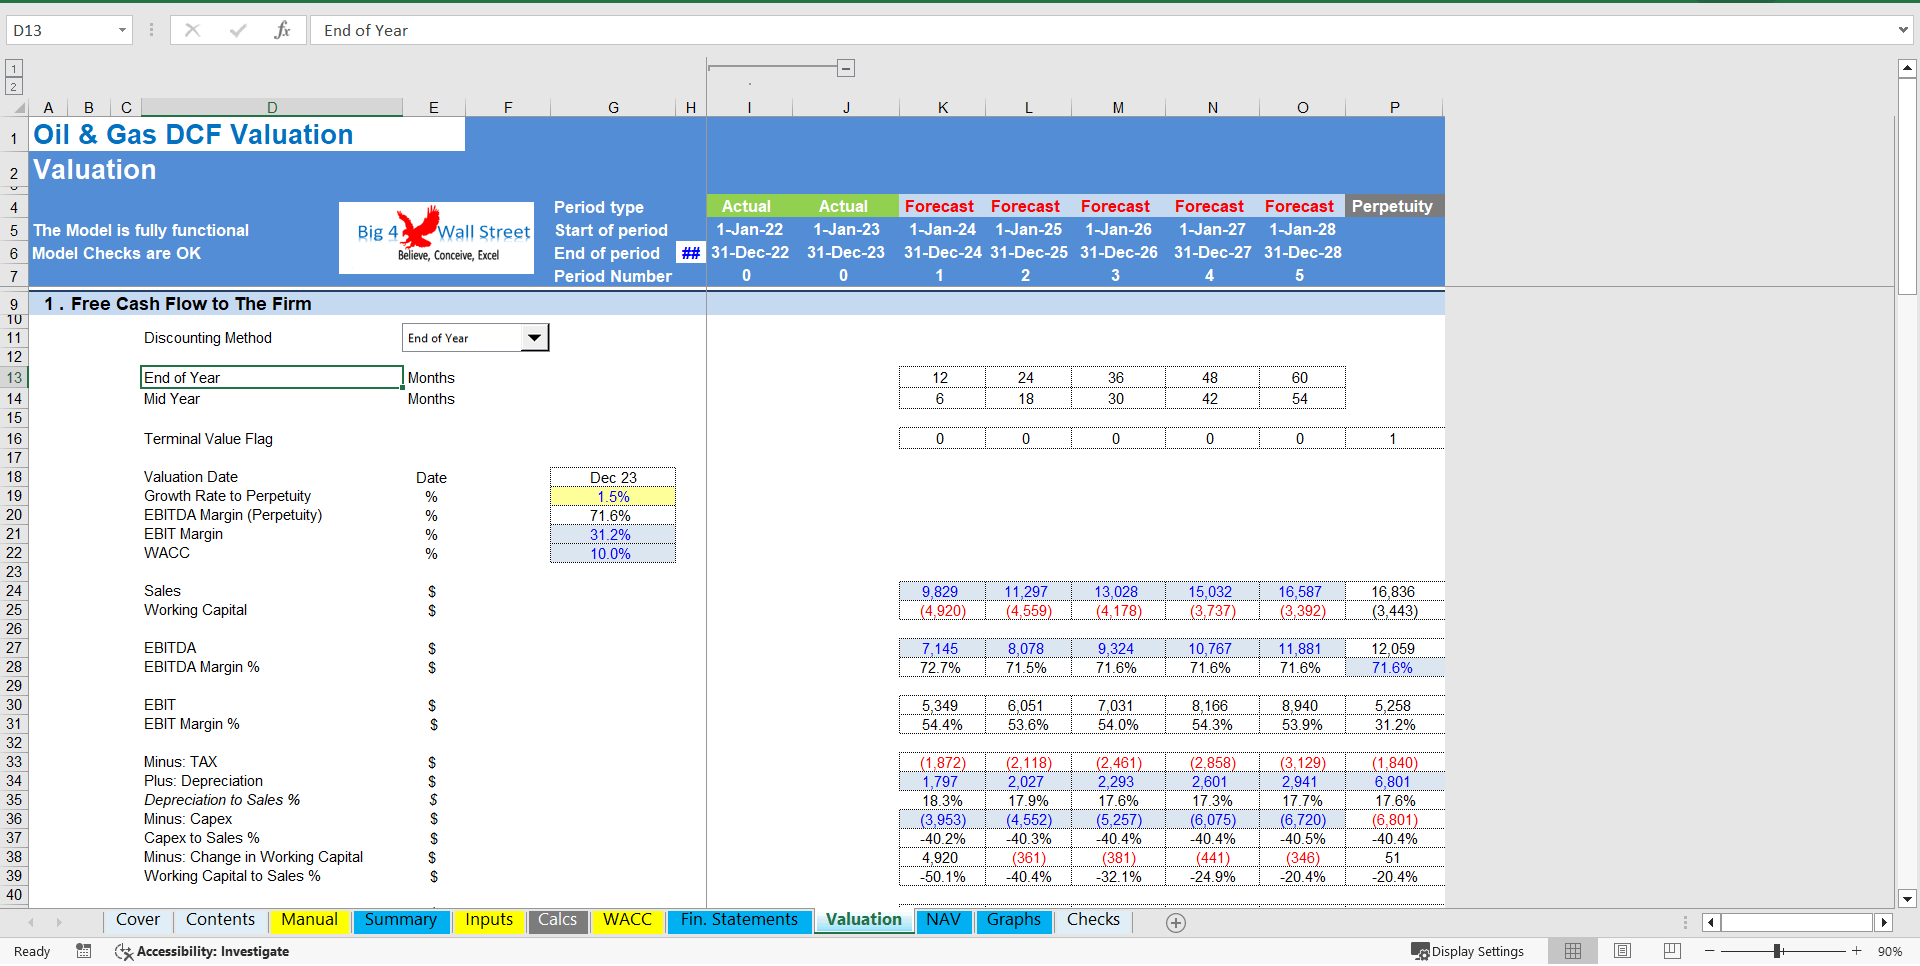
Moving to the Valuation tab, a valuation is performed by using the free cash flows to the firm and then a series of investment metrics are presented (Net Present Value, Internal Rate of Return, Profitability Index, Payback Period, Discounted Payback Period, Sensitivity Analysis).
In the NAV tab, the net asset value calculates the value by considering the company's assets, which include proven reserves of oil and gas, and other undeveloped land, and then subtracts liabilities such as debt and production and development costs.
In the Graphs tab: Various graphs present the business metrics, revenues, operating costs, and profitability. Then multiple charts present the working capital, debt & equity along with cash, assets, and cash flows which results in a valuation on a project basis as well as on an equity basis together with the feasibility metrics.
Checks: A dedicated worksheet that makes sure that everything is working as it should!
Important Notice: Yellow indicates inputs and assumptions that the user can change, blue cells are used for called up cells, and white cells with black characters indicates calculation cells.
Got a question about the product? Email us at support@flevy.com or ask the author directly by using the "Ask the Author a Question" form. If you cannot view the preview above this document description, go here to view the large preview instead.
Source: Best Practices in Oil & Gas, Integrated Financial Model Excel: Oil & Gas Financial Model – DCF and NAV Valuation (5+ Yrs.) Excel (XLSX) Spreadsheet, Big4WallStreet
ABOUT THE AUTHOR
We help small and midsize businesses' leaders with their strategic problems by creating or improving financial models, implementing tools to drive efficiency, performance, and better decision making.
With over 15 years of experience in Financial & Business Modeling / Planning, Performance & Analysis (Ernst & Young, Toyota, Viohalco and Upstream), we have developed strong business
... [read more]
Ask the Author a Question
You must be logged in to contact the author.
