
Regional 5-year Growth Trends (PowerPoint PPT Slide Deck)
PowerPoint (PPT) 5 Slides FlevyPro Document
Sorry, this document is currently only available to FlevyPro subscribers.
You can join FlevyPro for only $39/month.
DESCRIPTION
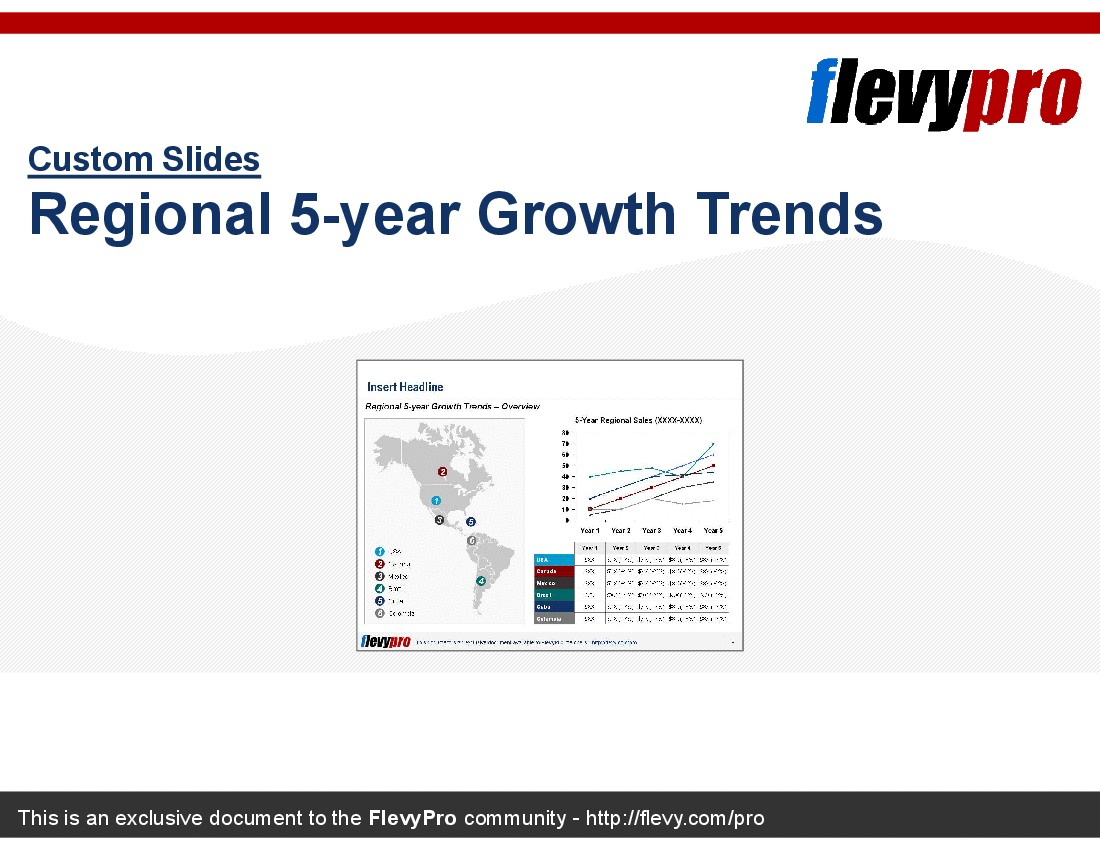
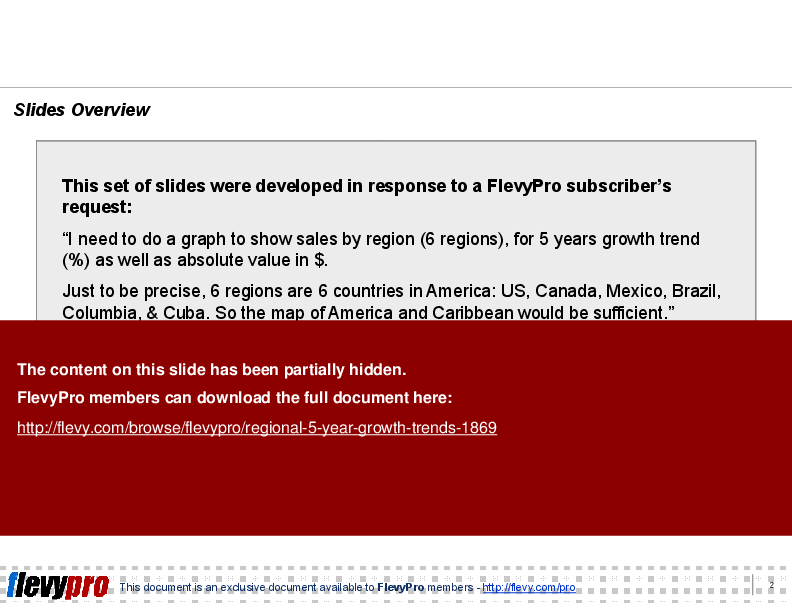
This set of slides were developed in response to a FlevyPro subscriber's request:
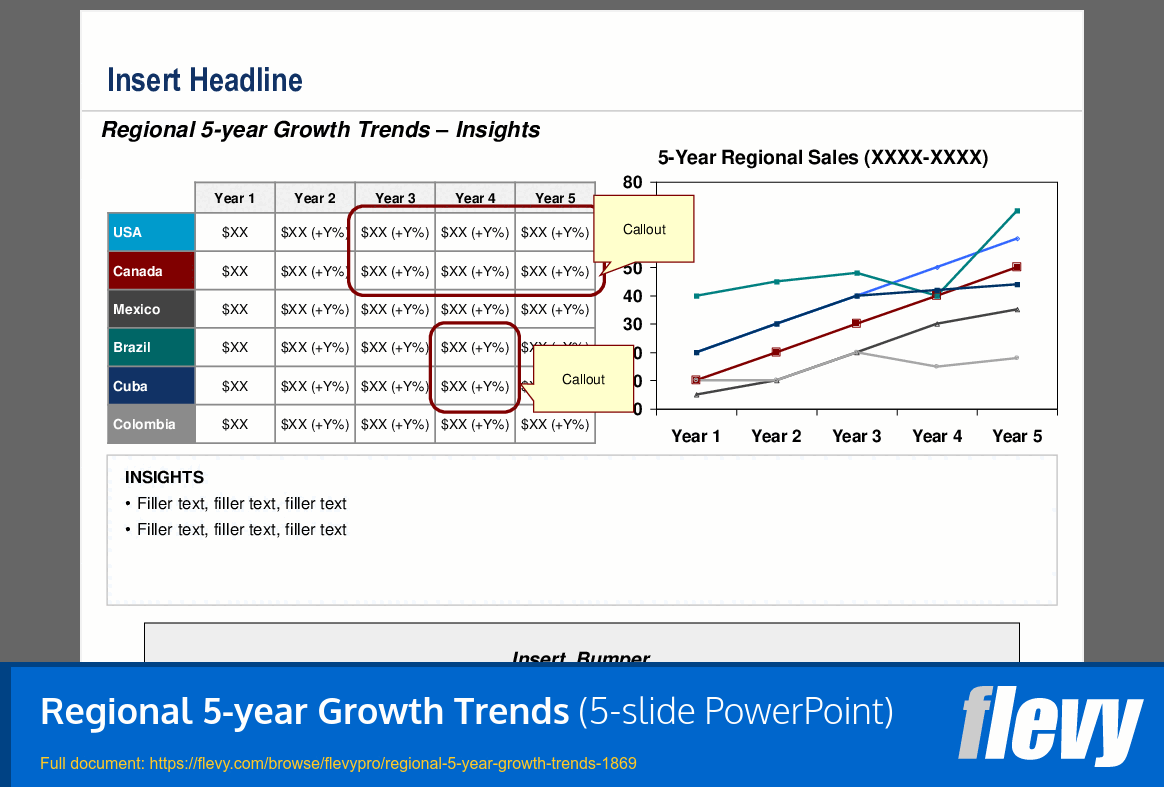
"I need to do a graph to show sales by region (6 regions), for 5 years growth trend (%) as well as absolute value in $.
Just to be precise, 6 regions are 6 countries in America: US, Canada, Mexico, Brazil, Columbia, & Cuba. So the map of America and Caribbean would be sufficient."
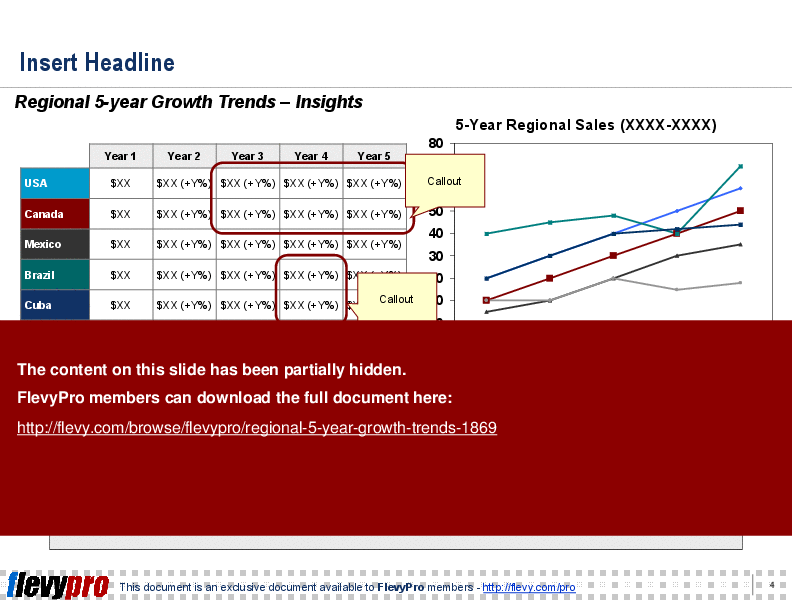
Two slides were created for this request.
Are you a FlevyPro subscriber? You can send your specific slide requests to flevypro@flevy.com. Please be as detailed as possible with your request.
Got a question about the product? Email us at flevypro@flevy.com. If you cannot view the preview above this document description, go here to view the large preview instead.
Source: Best Practices in Growth Trends PowerPoint Slides: Regional 5-year Growth Trends PowerPoint (PPT) Presentation Slide Deck, Flevy
Sorry, this document is currently only available to FlevyPro subscribers.
You can join FlevyPro for only $39/month.
Did you need more documents?
Consider a FlevyPro subscription from $39/month. View plans here.
