

Bitcoin Mining 3-Statement Financial Model – Excel XLSX
Excel (XLSX)
BENEFITS OF THIS DOWNLOADABLE EXCEL DOCUMENT
- Offers a detailed framework for accurate revenue forecasting and cost management specific to Bitcoin mining operations.
- Facilitates strategic decision-making with integrated financial statements and comprehensive valuation analysis.
- Enhances financial planning with visually insightful graphs and key performance indicators tailored to Bitcoin mining.
BITCOIN EXCEL DESCRIPTION
This financial model is designed to forecast the operating and financial performance of a Bitcoin mining operation. It is built for mining facilities deploying ASIC hardware to generate Bitcoin by contributing computing power to the global Bitcoin network.
The model captures the key drivers of mining economics, including miner fleet size, network hash rate competition, block reward halving events, transaction fees, electricity consumption, and infrastructure investments. Users can model month-wise miner additions to estimate Bitcoin production, revenue, and operating costs over time.
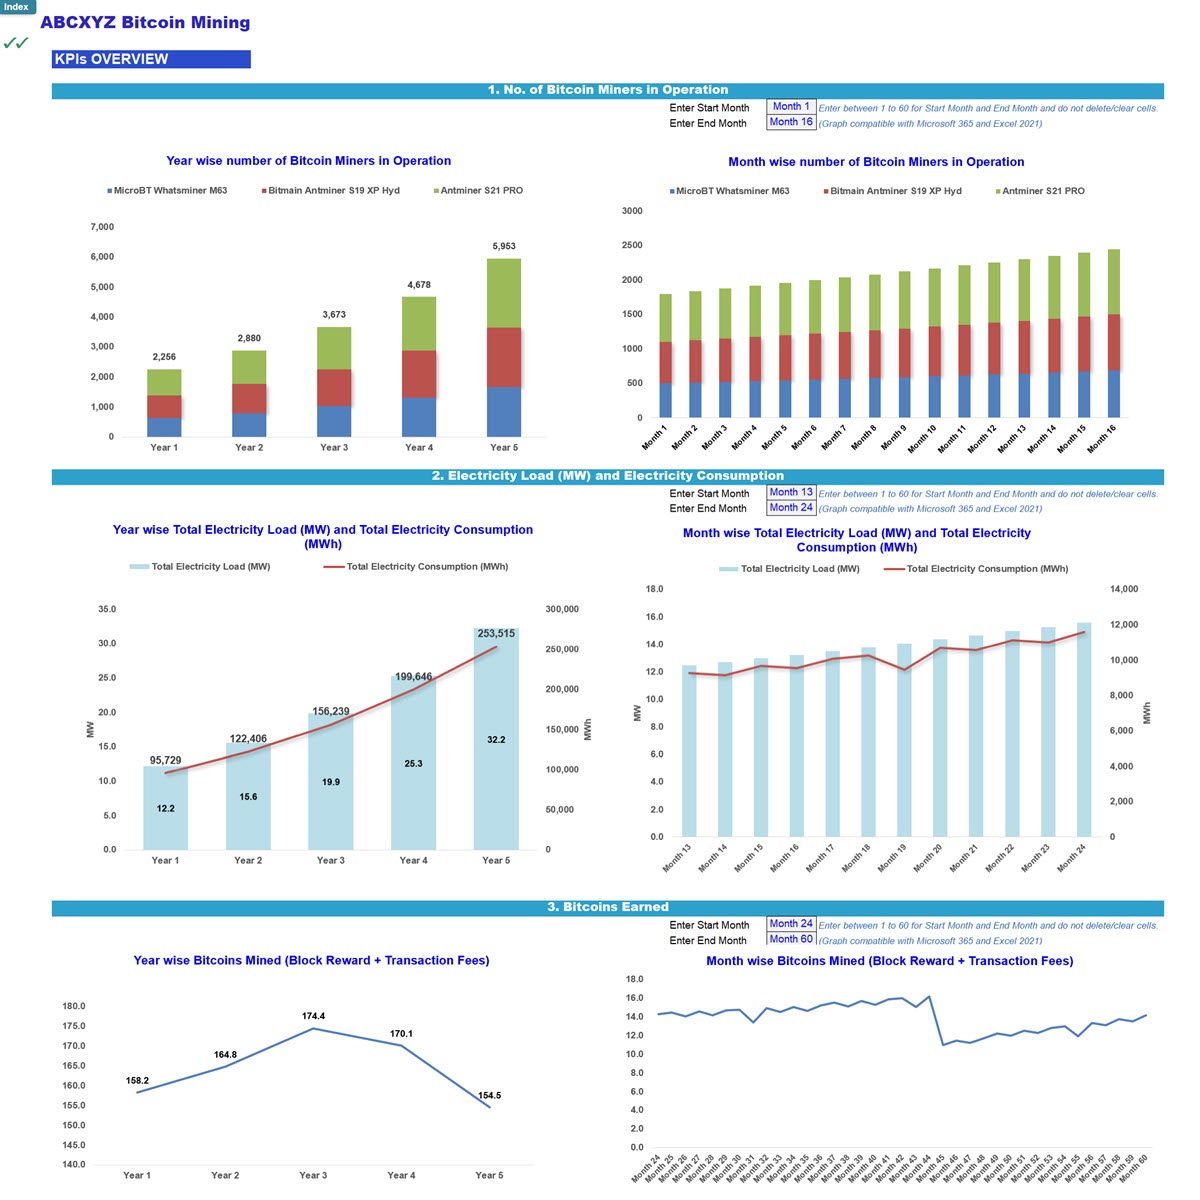
What the Model Covers
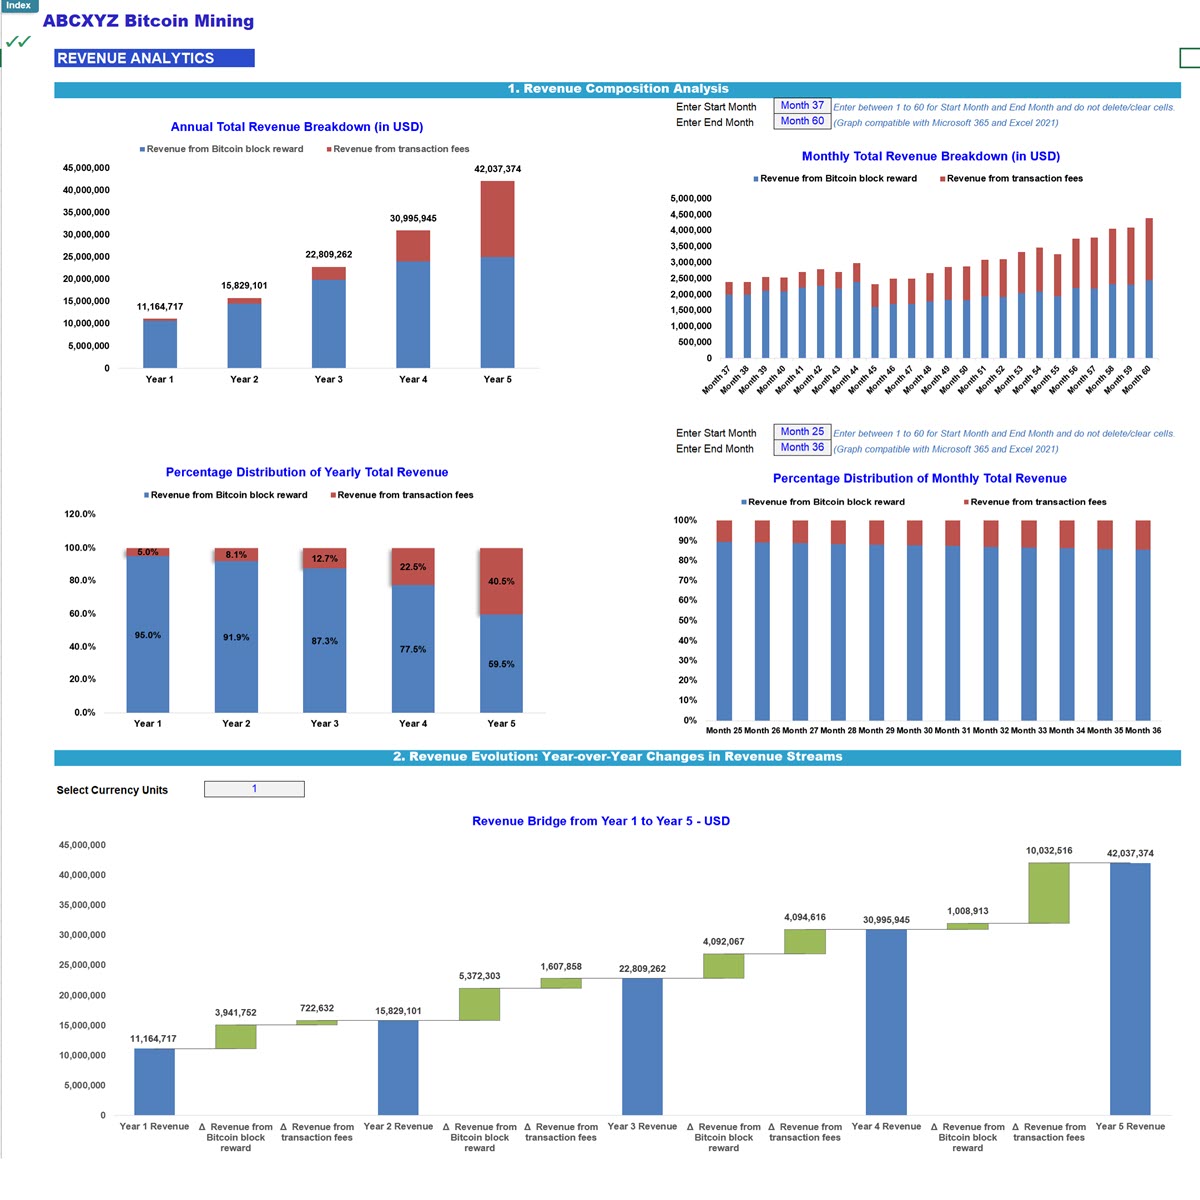
Revenue & Mining Production
• Bitcoin mining revenue based on fleet hash rate and global network hash rate
• Block reward schedule including halving events
• Transaction fee assumptions and mining pool fees
• Bitcoin price assumptions
Operating Costs
• Electricity consumption based on miner power draw and facility efficiency (PUE)
• Electricity pricing and inflation
• Hosting, maintenance, and machine-related operating costs
Capital Investments & Operations
• ASIC miner purchases and infrastructure investments
• Cooling, electrical systems, and facility buildout
• Administrative payroll and SG&A costs
Financing
• Equity funding and optional debt assumptions
• Sources and uses of funds analysis
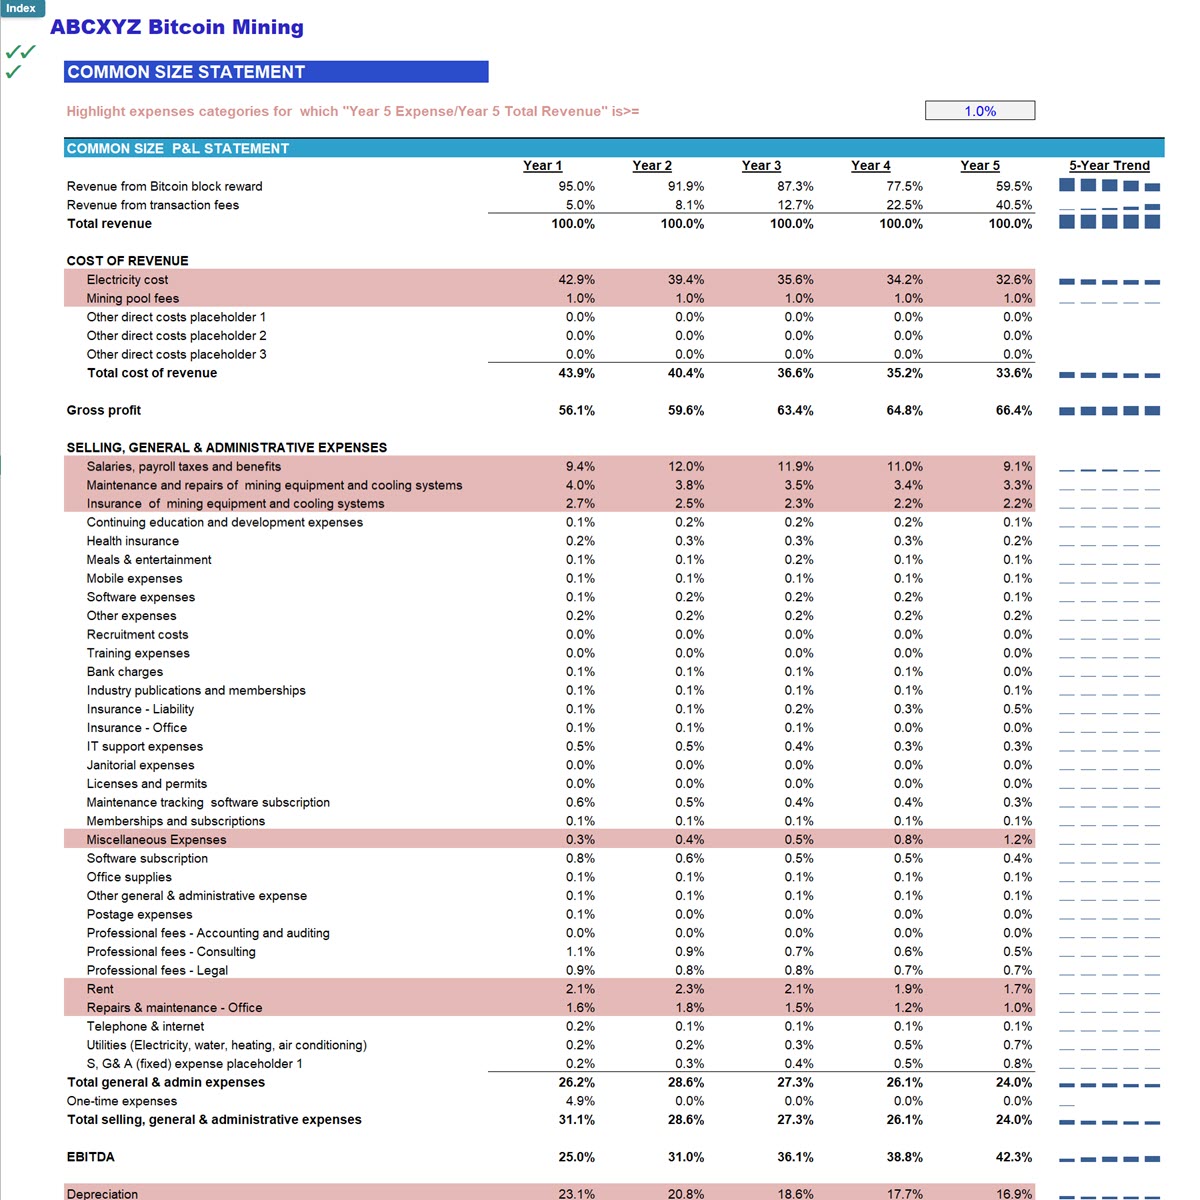
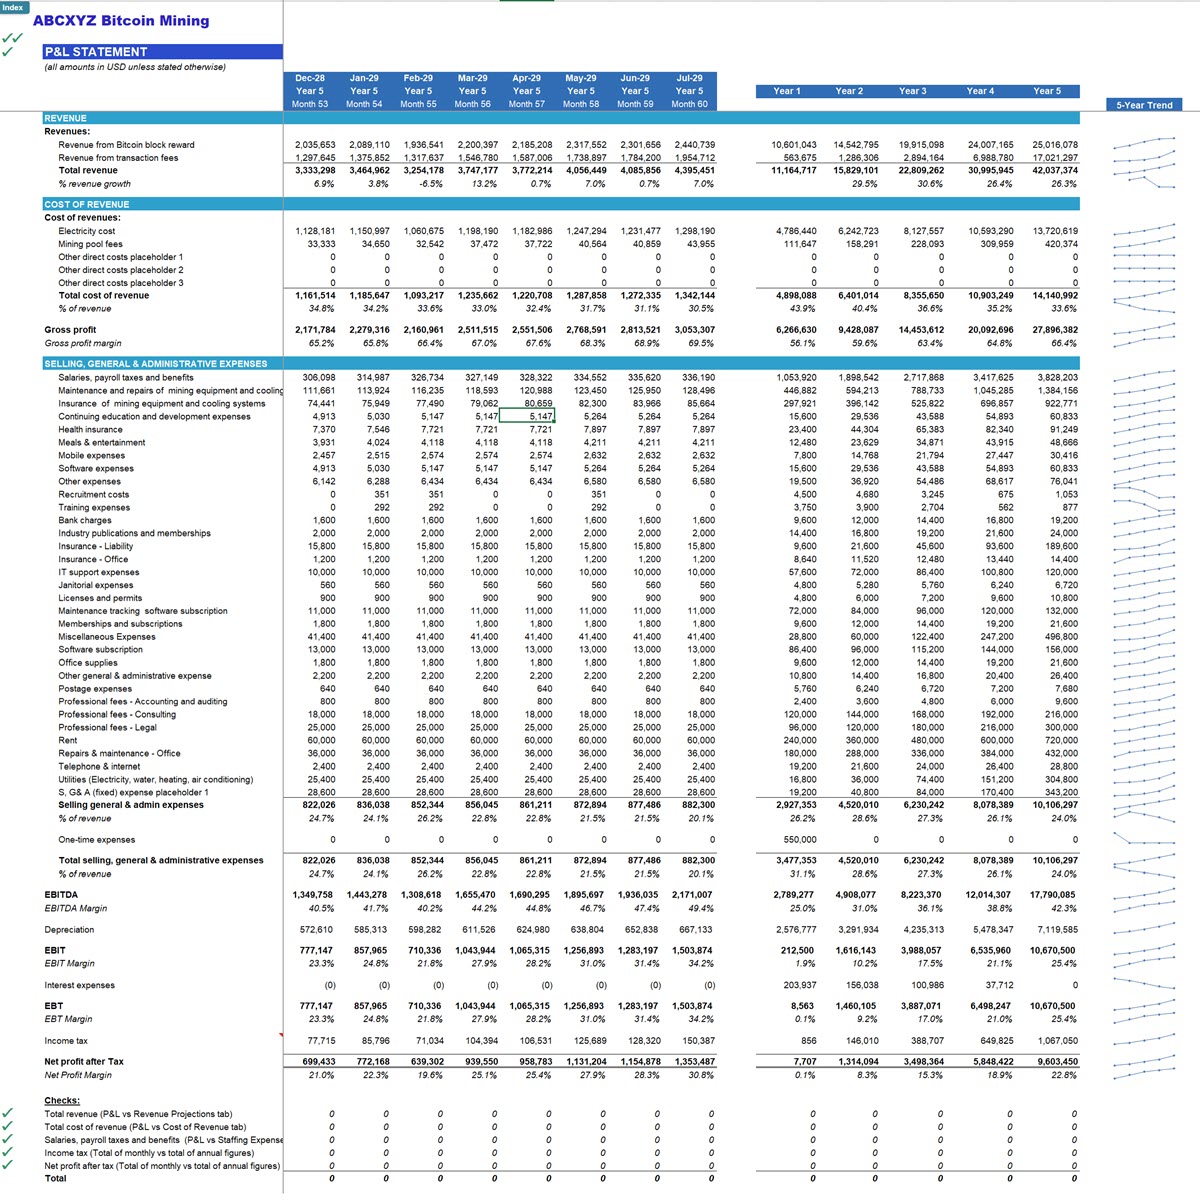
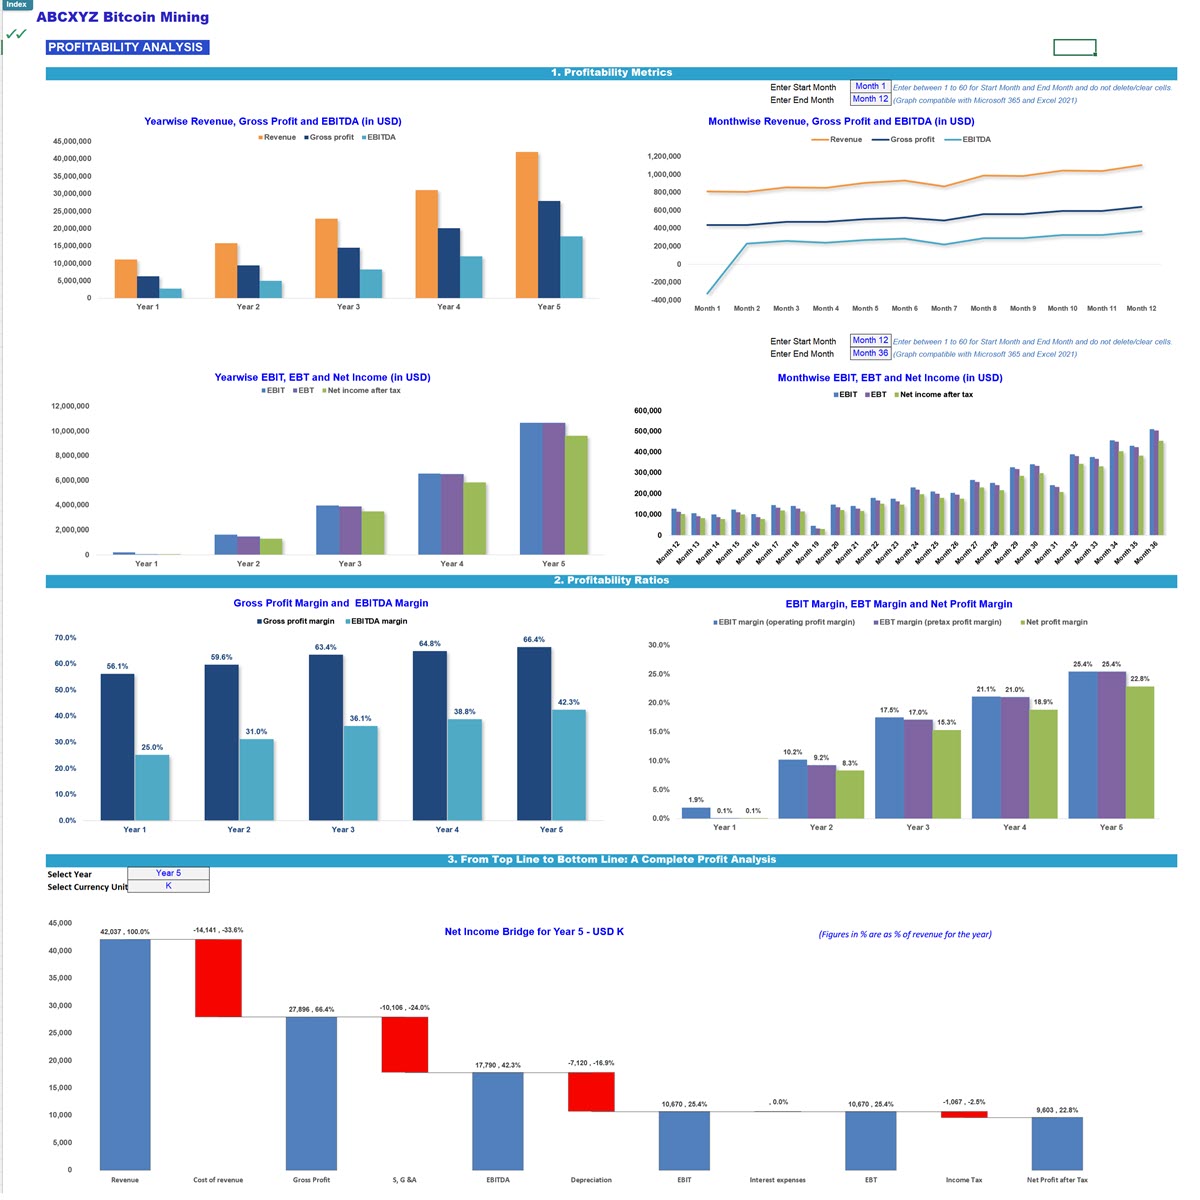
Financial Outputs
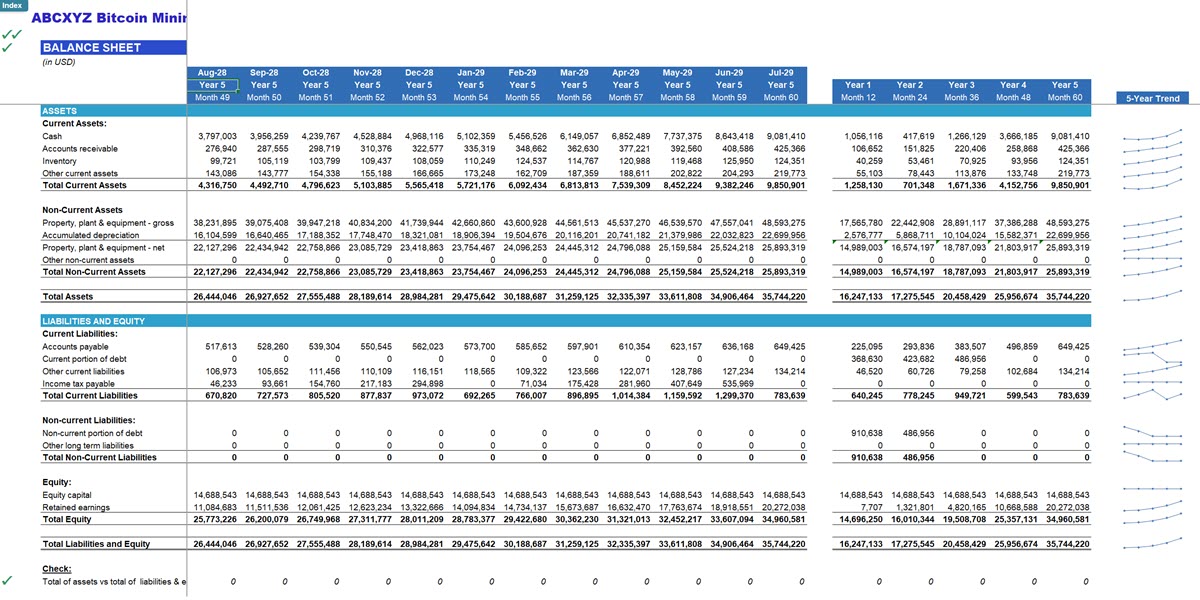
The model generates a 5-year (60-month) integrated forecast, including:
• Profit & Loss Statement
• Balance Sheet
• Cash Flow Statement
• Key mining profitability metrics
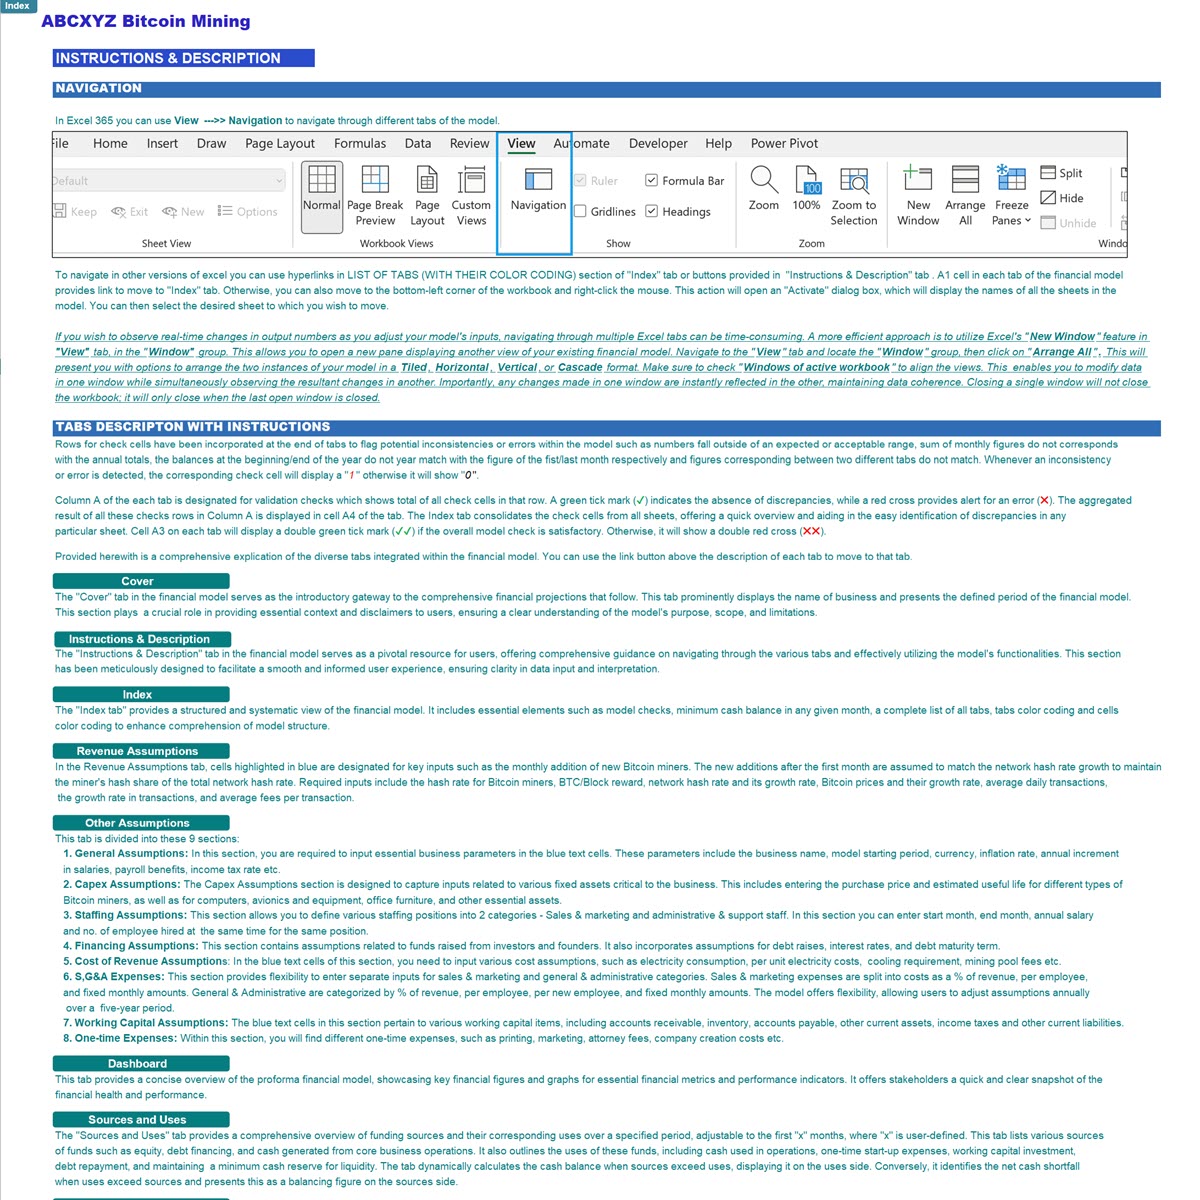
Technical Features
• Fully transparent structure (no VBA / no macros)
• Circular-reference free
• Compatible with Excel 2010 or newer
This model is suitable for founders, investors, and financial advisors evaluating the profitability, capital requirements, and long-term sustainability of a Bitcoin mining operation.
Got a question about the product? Email us at support@flevy.com or ask the author directly by using the "Ask the Author a Question" form. If you cannot view the preview above this document description, go here to view the large preview instead.
Source: Best Practices in Bitcoin, Integrated Financial Model Excel: Bitcoin Mining 3-Statement Financial Model Excel (XLSX) Spreadsheet, ExcelFinModels
ABOUT THE AUTHOR
I am a finance professional with over 15 years of experience in financial modeling, analysis, planning, budgeting, and forecasting on various freelancing platforms. I have assisted over 500 start-ups and SMBs across diverse industries in securing over $1 billion in funding, internal planning, financial reporting, and strategy formulation. Additionally, I have provided services to numerous ... [read more]
Ask the Author a Question
You must be logged in to contact the author.
