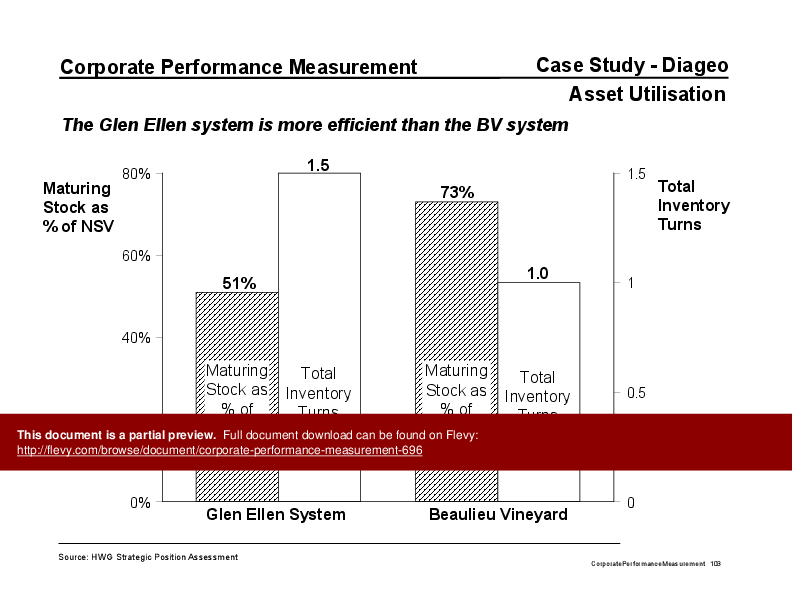
This PPT slide, part of the 106-slide Corporate Performance Measurement PowerPoint presentation, presents a comparative analysis of asset utilization between 2 systems: the Glen Ellen system and the Beaulieu Vineyard (BV) system, specifically focusing on maturing stock as a percentage of net sales value (NSV) and total inventory turns.
The bar graph illustrates that the Glen Ellen system has a maturing stock percentage of 51%, while the BV system shows a higher percentage of 73%. This indicates that a larger portion of the inventory in the BV system is tied up in maturing stock, which could imply less efficiency in inventory management. The total inventory turns for the Glen Ellen system stand at 1.5, surpassing the BV system's 1.0. This suggests that the Glen Ellen system is more effective in converting inventory into sales, reflecting better operational efficiency.
The title of the slide emphasizes the efficiency of the Glen Ellen system over the BV system. The visual representation makes it clear that while the BV system has a higher percentage of maturing stock, it does not translate into better inventory turnover. This could be a critical insight for decision-makers evaluating inventory management practices and overall operational effectiveness.
Understanding these metrics is essential for organizations aiming to optimize their asset utilization strategies. The findings could guide potential customers in assessing which system aligns better with their operational goals. The data presented here provides a clear rationale for considering the Glen Ellen system as a more efficient alternative.
This slide is part of the Corporate Performance Measurement PowerPoint presentation.
EXPLORE MORE SLIDES FROM THIS PRESENTATION
EXPLORE MORE PRESENTATIONS ON
Performance Management Shareholder Value Inventory Management Performance Measurement Sales
Flevy is the world's largest knowledge base of best practices.
![]()
Leverage the Experience of Experts.
Find documents of the same caliber as those used by top-tier consulting firms, like McKinsey, BCG, Bain, Deloitte, Accenture.
![]()
Download Immediately and Use.
Our PowerPoint presentations, Excel workbooks, and Word documents are completely customizable, including rebrandable.
![]()
Save Time, Effort, and Money.
Save yourself and your employees countless hours. Use that time to work on more value-added and fulfilling activities.

