Trusted by over 10,000+ Client Organizations
Since 2012, we have provided best practices to over 10,000 businesses and organizations of all sizes, from startups and small businesses to the Fortune 100, in over 130 countries.
We have categorized 3 documents as BCG Growth-Share Matrix. All documents are displayed on this page.
As Jim Collins, author and management guru, famously stated, "The great companies didn't think outside the box; they thought in a different box," the framework of the BCG Growth-Share Matrix encourages just that. Being an expert in the field of Strategic Management, I will dig into this compelling management tool and present it in a way that it offers meaningful insights and best practices to C-level executives.
As Jim Collins, author and management guru, famously stated, "The great companies didn't think outside the box; they thought in a different box," the framework of the BCG Growth-Share Matrix encourages just that. Being an expert in the field of Strategic Management, I will dig into this compelling management tool and present it in a way that it offers meaningful insights and best practices to C-level executives.
For effective implementation, take a look at these BCG Growth-Share Matrix best practices:
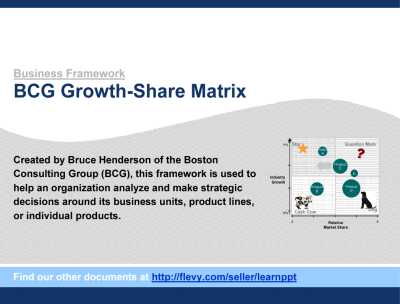
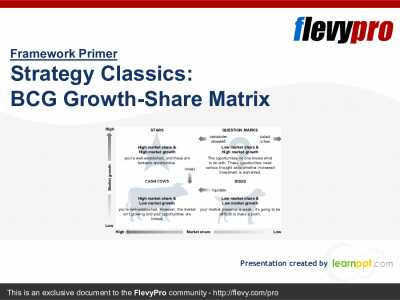
At its core, the Boston Consulting Group's Growth-Share Matrix is a portfolio planning model that assists organizations in decision-making regarding their product line. The matrix comprises four quadrants—Cash Cows, Dogs, Stars, and Question Marks—based on an assessment of market growth rate and relative market share.
In Strategic Planning, the BCG Growth-Share Matrix can be a dynamic tool for C-level executives. As it allows an objective and quantifiable analysis of the company's portfolio, it proves beneficial in three primary domains: Product Development, Market Segmentation, and Competitive Analysis. By classifying the offerings as Cash Cows, Dogs, Stars, or Question Marks, strategies such as maintenance, divestiture, investment, or development can be formulated respectively.
Explore related management topics: Strategic Planning Competitive Analysis Market Segmentation
The BCG Growth-Share Matrix is not just a strategic planning tool but also one that facilitates Operational Excellence. By highlighting both successful and under-performing products, the matrix enables businesses to optimize resource allocation and prioritize improvement efforts. Executives can thus ensure that resource deployment is aligned with broader business strategies and growth ambitions.
Explore related management topics: Operational Excellence
Like all management tools, the BCG Growth-Share Matrix is not without its limitations. The matrix overlooks factors such as market competition and financial implications and assumes that high market share always leads to profitability. Therefore, while it's a potent instrument in the executive toolkit, its usage should be complemented by other frameworks and a solid understanding of the evolving market landscape.
Used in tandem with Digital Transformation efforts, the BCG Growth-Share Matrix can offer fresh insights and unearth new opportunities. It aids in discerning where best to utilize technological advancements and data-driven decision making. It can guide executives in adapting their product portfolio to an increasingly integration-focused, digital world.
Explore related management topics: Digital Transformation Decision Making
For a more robust approach to Strategic Management, the matrix can be integrated with other tools such as SWOT Analysis, Porter's Five Forces Analysis, and Risk Management methodologies. This holistic application provides a more refined and well-rounded strategy.
Explore related management topics: Risk Management Porter's Five Forces SWOT Analysis
Despite its limitations, the BCG Growth-Share Matrix continues to be a valued tool, primarily because of its simplicity and ease of use. Coupled with evolving business intelligence tools and advanced analytics, it's likely to retain its relevance in the multifaceted world of Strategic Management.
Executives must remember that Strategic Management is not just about models and matrices. It's also about thinking in different boxes. Charles Darwin’s words sum it up aptly, "It is not the strongest of the species that survives, nor the most intelligent, but the one most responsive to change. "
Explore related management topics: Business Intelligence
Here are our top-ranked questions that relate to BCG Growth-Share Matrix.
BCG Growth-Share Matrix Best Practices
BCG Growth-Share Matrix Overview Understanding the BCG Growth-Share Matrix Components of the Matrix—and Strategic Implications Application of BCG Growth-Share Matrix in Strategic Planning The BCG Matrix and Operational Excellence Limitations and Considerations Digital Transformation and the BCG Matrix Integration with other Management Tools The BCG Growth-Share Matrix in the Future BCG Growth-Share Matrix FAQs Flevy Management Insights Case Studies
CUSTOMERS ALSO VIEWED THESE RESOURCES
E-commerce Portfolio Rationalization for Online Retailer
Scenario: The organization in question operates within the e-commerce sector, managing a diverse portfolio of products across multiple categories.
BCG Growth-Share Matrix Analysis for a High-Tech Corporation
Scenario: A multinational technology firm is facing challenges interpreting its BCG Growth-Share Matrix.
BCG Matrix Analysis for Semiconductor Firm
Scenario: A semiconductor company operating globally is facing challenges in allocating resources efficiently across its diverse product portfolio.
BCG Matrix Evaluation for Agritech Firm in Competitive Landscape
Scenario: An Agritech firm operating within a highly competitive sector is seeking to evaluate its product portfolio to better allocate resources and drive focused growth.
Portfolio Optimization for Electronics Manufacturer
Scenario: The organization is a mid-sized electronics manufacturer specializing in consumer audio equipment.
Strategic Portfolio Management for Agritech Firm in Competitive Landscape
Scenario: A firm within the agritech sector is grappling with diversified interests across different agricultural technology ventures.
Strategic Portfolio Management for D2C Lifestyle Brands
Scenario: A direct-to-consumer lifestyle brand in the competitive wellness space is facing challenges in allocating its resources effectively across its diverse product portfolio.
Luxury Brand Portfolio Optimization in the High-End Fashion Sector
Scenario: A luxury fashion house is grappling with portfolio optimization amidst shifting consumer trends and market volatility.
BCG Matrix Assessment for Retail Apparel in Competitive Market
Scenario: The organization in focus operates within the highly competitive retail apparel sector.
Strategic Portfolio Management for Ecommerce in Health Supplements
Scenario: An ecommerce company specializing in health supplements is struggling to manage its expansive product portfolio.
Strategic Portfolio Management for Aerospace Manufacturer in Competitive Sector
Scenario: The organization is a prominent player in the aerospace industry, grappling with the challenge of allocating resources across its diverse product lines.
Strategic Portfolio Analysis for Retail Chain in Competitive Sector
Scenario: The organization is a retail chain operating in a highly competitive consumer market, with a diverse portfolio of products ranging from high-turnover items to niche, specialty goods.
Explore all Flevy Management Case Studies
![]()
Leverage the Experience of Experts.
Find documents of the same caliber as those used by top-tier consulting firms, like McKinsey, BCG, Bain, Deloitte, Accenture.
![]()
Download Immediately and Use.
Our PowerPoint presentations, Excel workbooks, and Word documents are completely customizable, including rebrandable.
![]()
Save Time, Effort, and Money.
Save yourself and your employees countless hours. Use that time to work on more value-added and fulfilling activities.

|
Download our FREE Strategy & Transformation Framework Templates
Download our free compilation of 50+ Strategy & Transformation slides and templates. Frameworks include McKinsey 7-S, Balanced Scorecard, Disruptive Innovation, BCG Curve, and many more. |
Download our free compilation of 50+ Strategy & Transformation slides and templates. Frameworks include McKinsey 7-S, Balanced Scorecard, Disruptive Innovation, BCG Curve, and many more.
© 2012-2024 Copyright. Flevy LLC. All Rights Reserved.