
035_Introduction to Graphical Analysis (PowerPoint PPTX)
BUY WITH CONFIDENCE
DESCRIPTION
This product (035_Introduction to Graphical Analysis) is a 31-slide PPT PowerPoint presentation (PPTX) with a supplemental Excel document, which you can download immediately upon purchase.
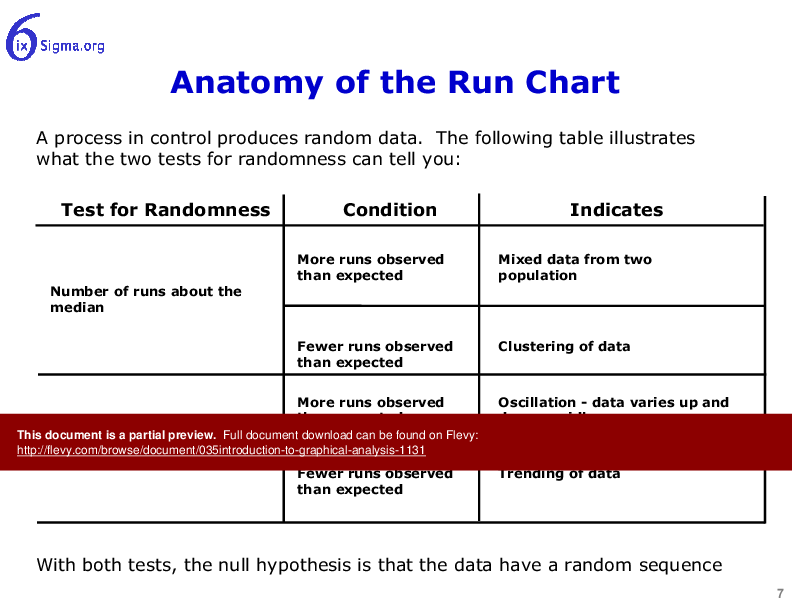
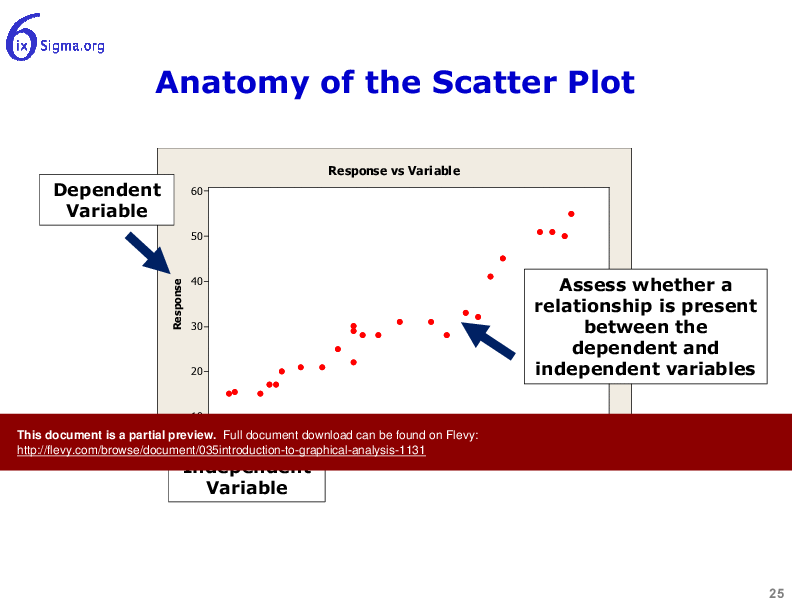
In real estate the rule used to guide success is location, location, location! In other words, buy in the right location and the rest will take care of itself. In data analysis the rule used to guide success is plot, plot, plot! In other words, before any other analysis is undertaken, plot the data. There is truth in the saying ?a picture paints a thousand words?. This is a very powerful concept and surprisingly . . . often overlooked.
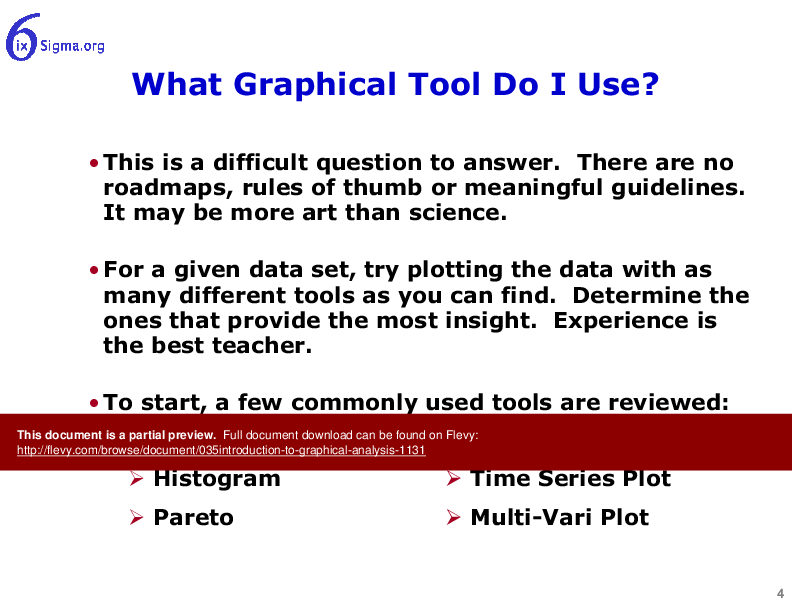
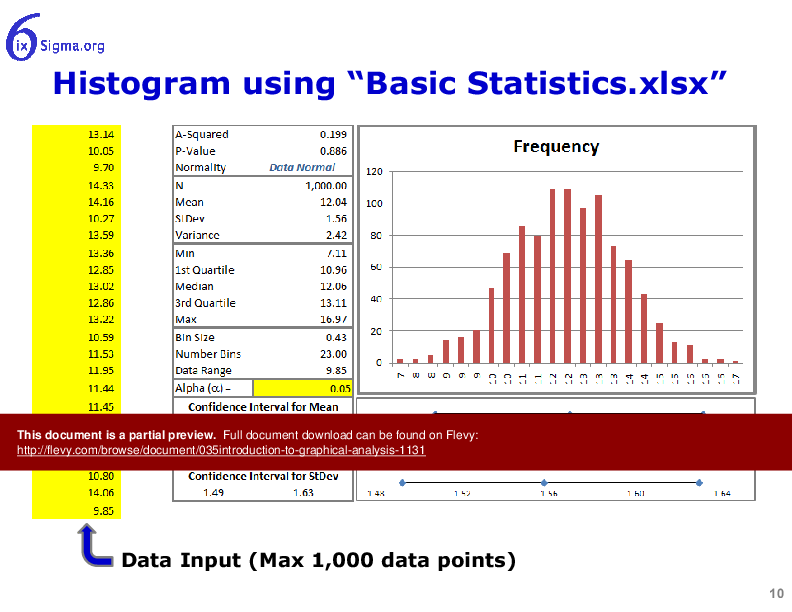
The objectives of this module are to: understand the basic graphical tools used to analyze project data, review the use of Minitab and a variety of 6ixsigma<dot>org tools to generate graphical analysis. The material is suitable for independent study or formal classroom training and includes several exercises, a list of tools and quiz questions.
Got a question about the product? Email us at support@flevy.com or ask the author directly by using the "Ask the Author a Question" form. If you cannot view the preview above this document description, go here to view the large preview instead.
Source: 035_Introduction to Graphical Analysis PowerPoint (PPTX) Presentation, [x]mjcarter
OVERVIEW
![]() (PPTX)
(PPTX)![]() (XLSX)
(XLSX)
Consulting Frameworks Growth Strategy Strategy Frameworks KPI Strategic Planning Organizational Design Gap Analysis Financial Modeling Strategy Development Business Case Development M&A (Mergers & Acquisitions) Bitcoin PowerPoint Diagrams Compilation Porter's Five Forces Sales PMP Integrated Financial Model Strategic Thinking Strategic Analysis Consulting Training Deal Structuring Private Equity ROI Mobile Strategy Cyber Security Customer Experience Business Transformation Digital Transformation Current State Assessment Maturity Model Real Estate Corporate Culture
