
007_Process Metrics (PowerPoint PPT)
BUY WITH CONFIDENCE
DESCRIPTION
This product (007_Process Metrics) is a 41-slide PPT PowerPoint presentation (PPT) with a supplemental Zip archive file document, which you can download immediately upon purchase.
Being able to measure a processes performance is a hallmark of Lean Six Sigma and selecting the appropriate metric is critical. LSS metrics fall into one of three categories: cost, quality, delivery. In this module we explore cost of poor quality, yield metrics, defect metrics, and waste elimination metrics.
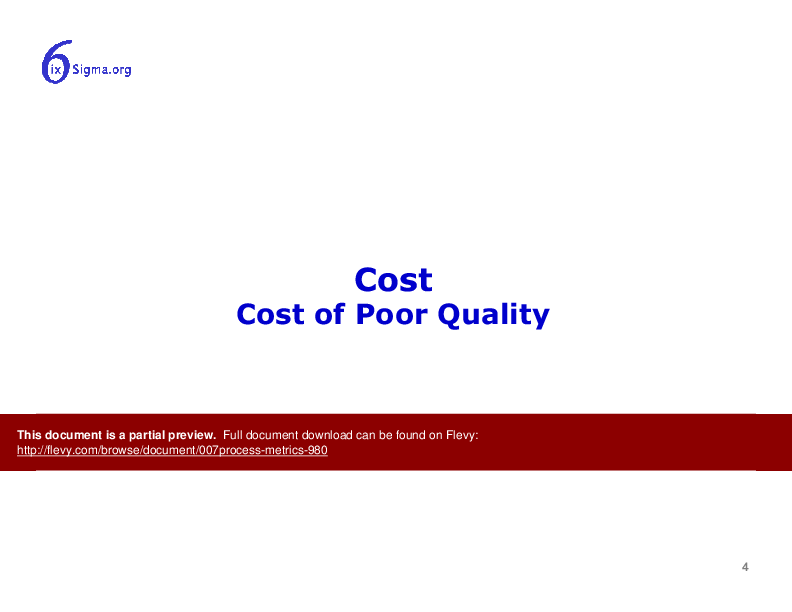
Cost of poor quality represents the difference between the actual cost of product or service and what the cost would be if the process were effective in manufacturing products that met the customer needs and were defect free.
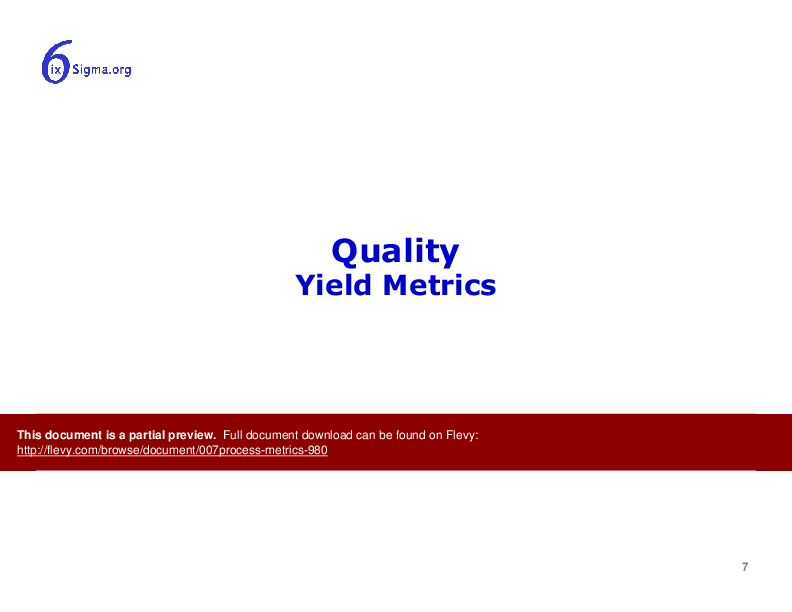
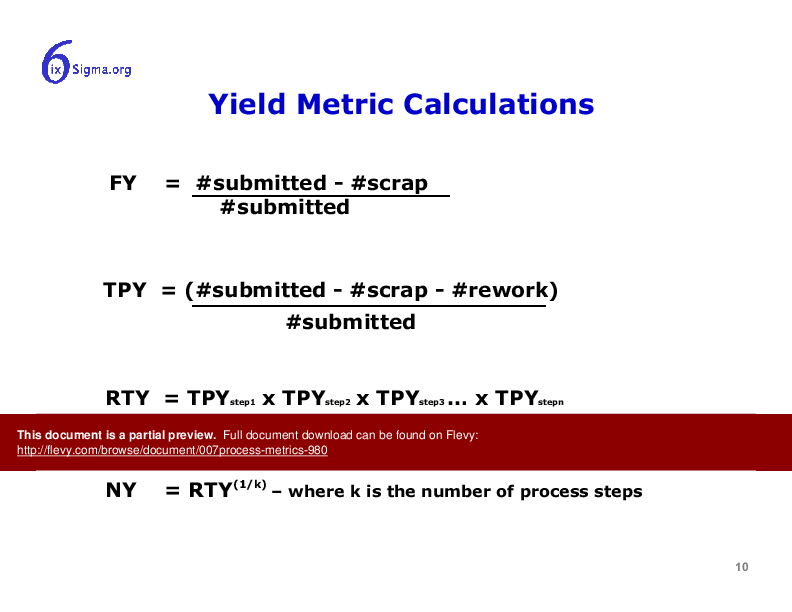
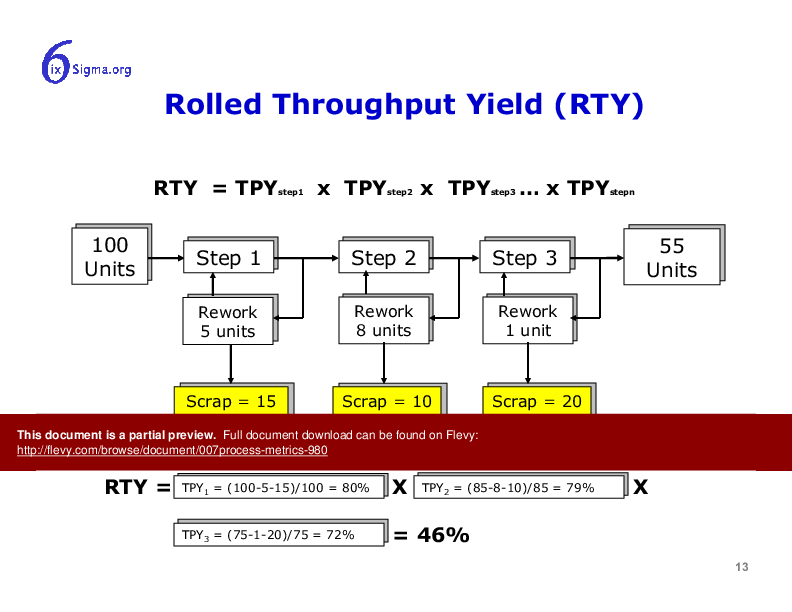
Yield metrics include Final Yield, Throughput Yield, Rolled Throughput Yield and Normalized Yield. These metrics are particularly adept at exposing the so called hidden factory – those activities that are necessary for acceptable quality because of one or more failures in the standard processes.
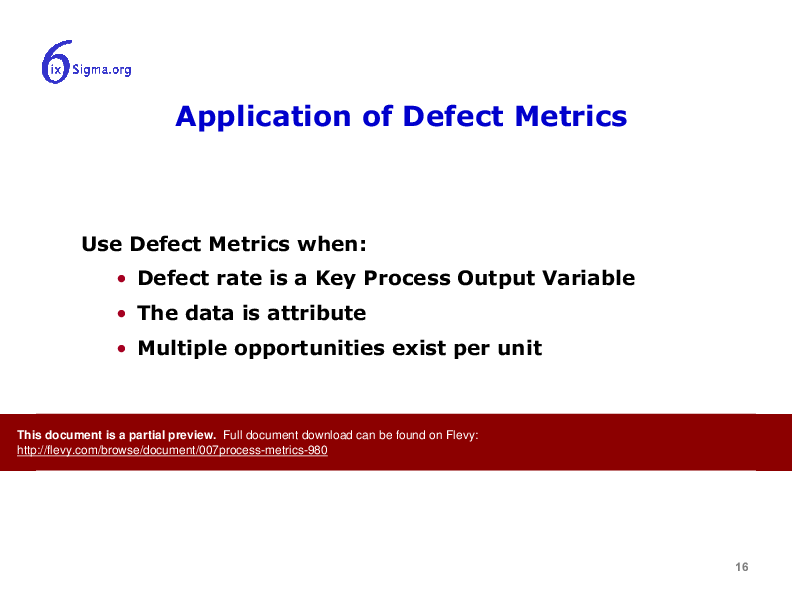
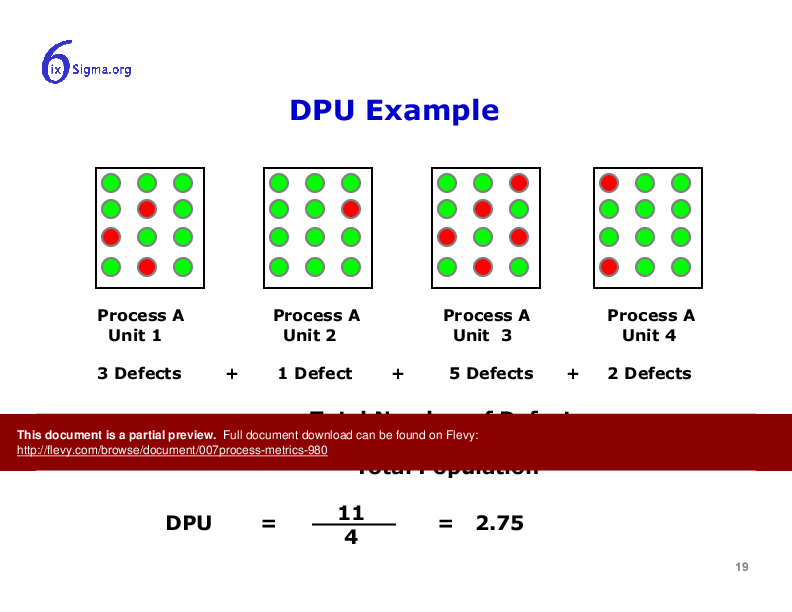
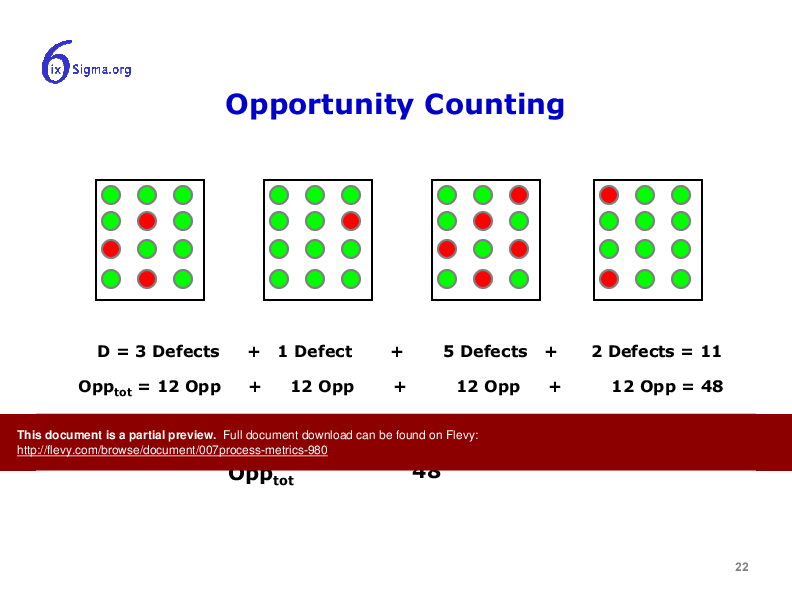
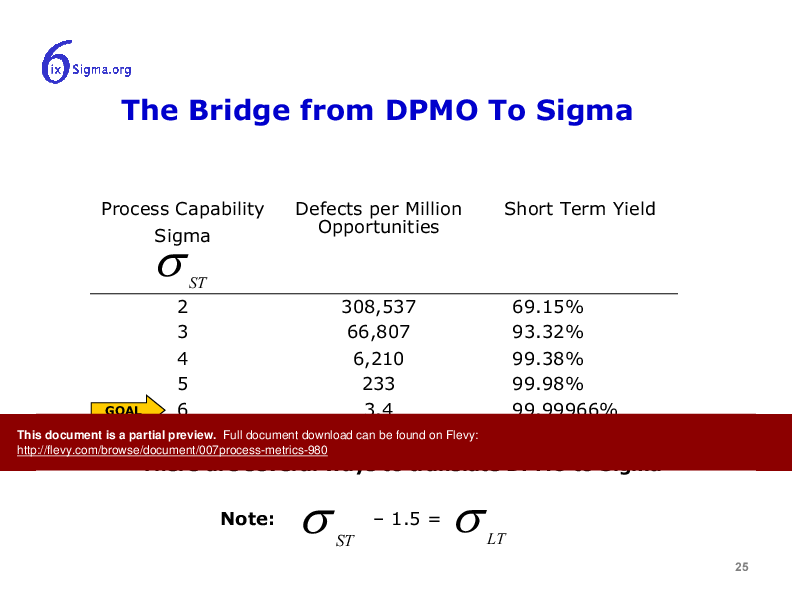
Defect metrics are used when the defect rate is a Key Process Output Variable or when the data is of the attribute type or when multiple opportunities (defects) exist per unit produced. This module covers the not well published but very important conversion from yield metrics to defect metrics and vice versa.
Waste elimination metrics are those that expose one or more of the seven wastes: transportation, inventory, motion, waiting, over production, over processing and defects. Common metrics include Takt Time, Cycle Time, Lead Time, Changeover Time.
This material is suitable for independent study or formal classroom training and includes a list of tools, an exercise, and quiz questions.
Comes with one Excel template: Yield and Defect Metrics
Got a question about the product? Email us at support@flevy.com or ask the author directly by using the "Ask the Author a Question" form. If you cannot view the preview above this document description, go here to view the large preview instead.
Source: Best Practices in Operational Excellence, Process Improvement PowerPoint Slides: 007_Process Metrics PowerPoint (PPT) Presentation, [x]mjcarter
OVERVIEW
![]() (PPT)
(PPT)![]() (ZIP)
(ZIP)
Operational Excellence Process Improvement Lean Management/Enterprise Process Analysis Strategic Planning Hoshin Kanri Strategy Deployment & Execution Kaizen Problem Solving Customer Service Rapid Improvement Event Visual Workplace Robotic Process Automation Digital Transformation Takt Time Lean Manufacturing Manufacturing Strategy Development Corrective and Preventative Action PDCA Value Stream Mapping Gemba Walk 8D Customer Decision Journey Project Management Balanced Scorecard Business Framework PowerPoint Diagrams Continuous Improvement Process Mapping Lean Office
